
(page 98 of 154)

Soltimer i Bergen de siste 5 årene fordelt per måned. Dataene er hentet fra Norsk klima service senter.

Diagrammet viser hvor stor andel i % av den totale skjermtiden min i uke 9 jeg brukte på appene med over 30 min skjermtid. Dataen er hentet fra…

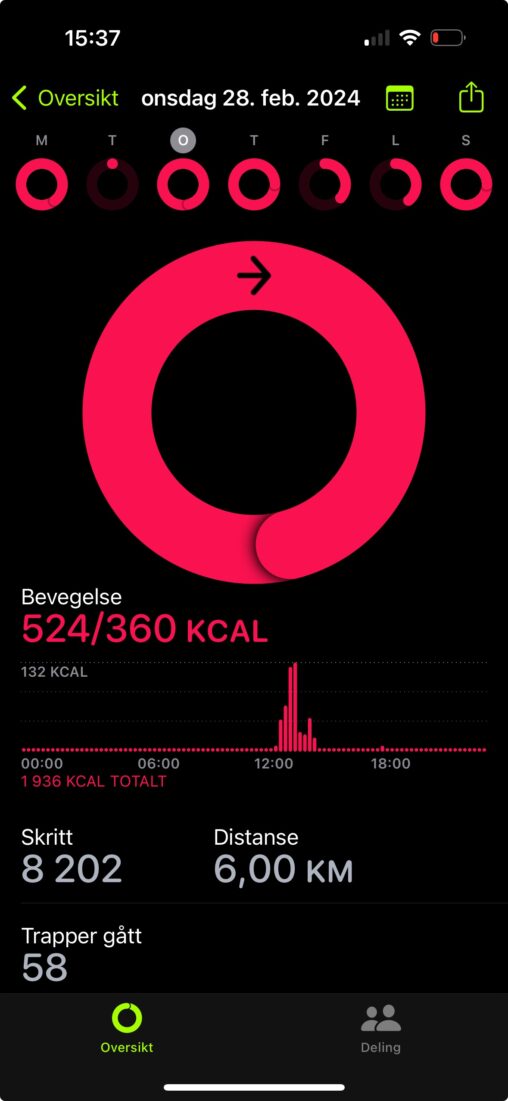
My monthly steps. I am the owner of the data. Data is captured from my Garmin watch.

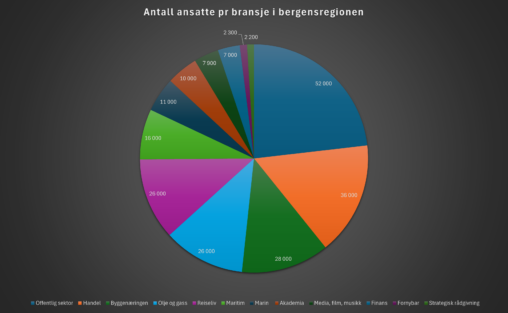
Kilde: Arbeidskraftundersøkelsen, Statistisk Sentralbyrå
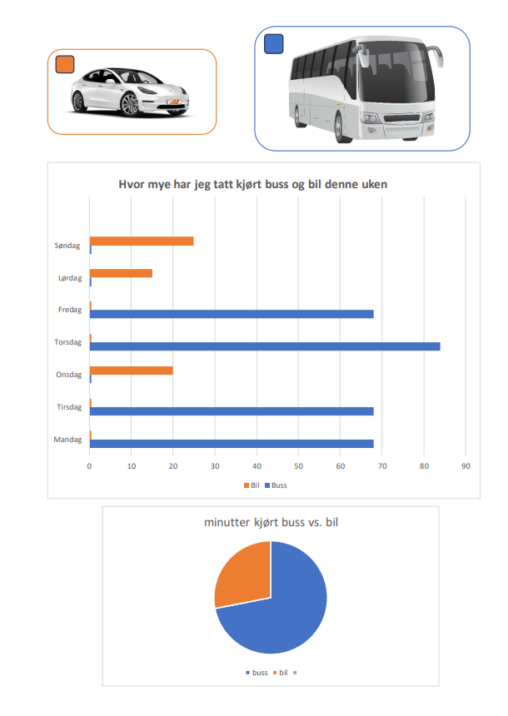
Hvor mye jeg har kjørt buss og bil i løpet av en uke. Dataen er samlet fra 26.02.24 – 02.03.24
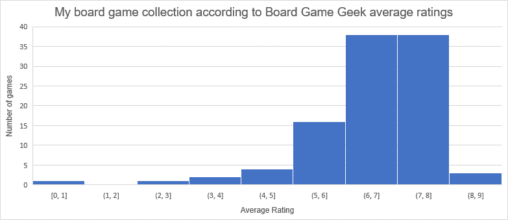
BoardGameGeek (BGG) is an online forum and database holding information, pictures, reviews, and discussions for more than one hundred thousand games. BGG allows users to rate board games…
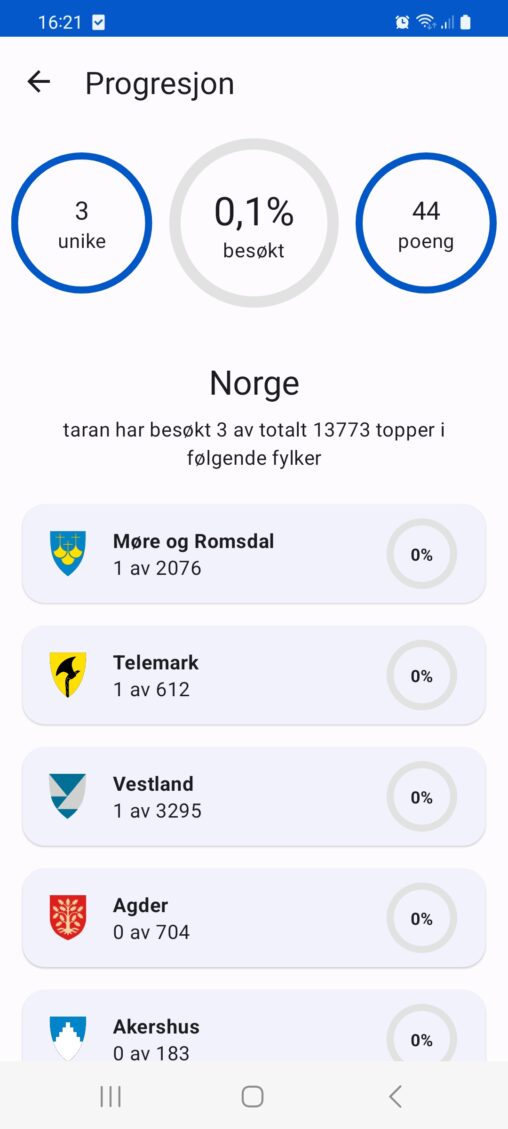
Data viser de tre av totalt 13773 fjelltoppene som har blitt registrert og prosentandelen dette utgjør. Hentet fra appen «Fjelltoppjakten»
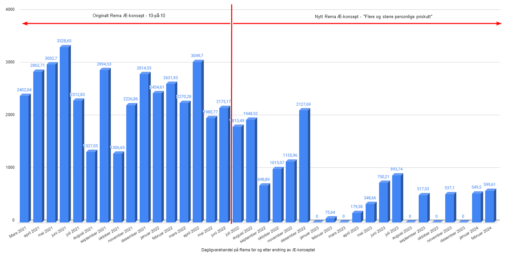
I juni 2022 endret Rema Æ-konseptet sitt, slik at man ikke lenger fikk 10% rabatt på de varene man brukte mest penger på. Dette var en ordning der…

Forskjellen på mm nedbør siste 30 døgn målt mellom Førde og Kongsvinger.
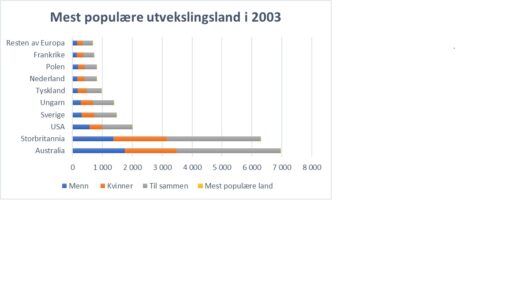
A table over the 10 most popular countries for norwegian exchange students in 2003

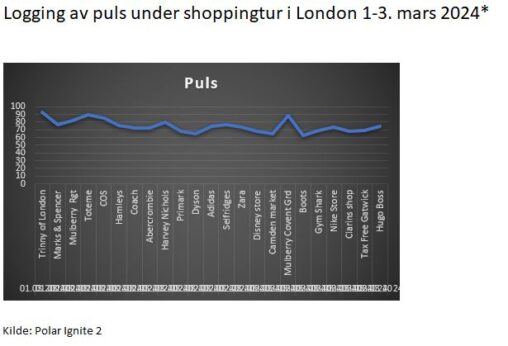
Heart rate measurement while shopping in departement stores/shops/markets in London 1st-3rd of March 2024. Measuring was made while entering the spesific shop and registered analogously. Database is slightly…
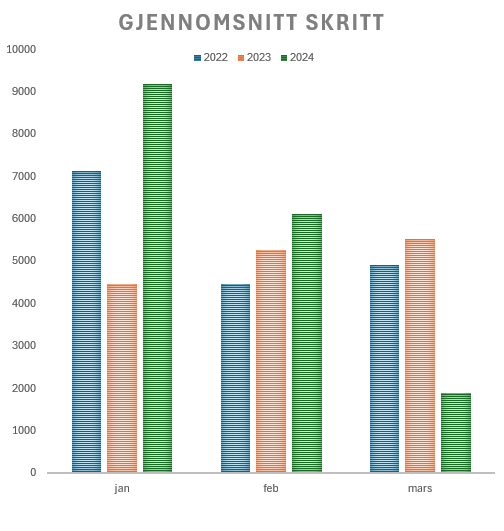
Eg laga ei lita oversikt over gjennomsnitt på skritt/mnd i perioden jan-mars i åra 2022-2024
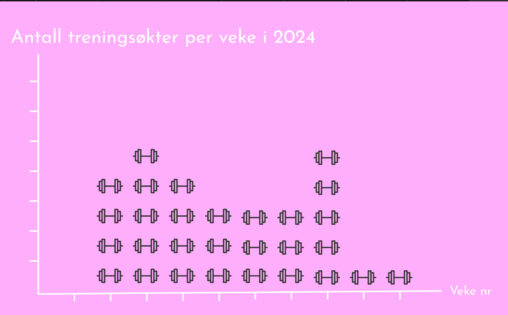
I´ve made a table visualizating how many times I worked out per week in 2024. The dumbbell icon represents one workout session. The x-axes represent week number, starting…