
(page 89 of 154)
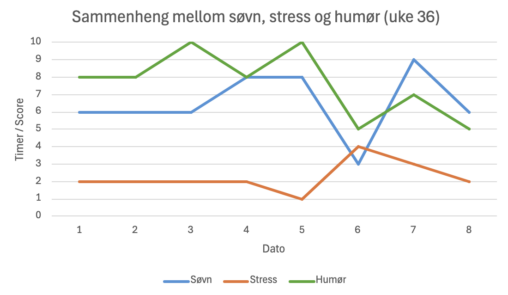
Et linjediagram som viser sammenhengen mellom antall timer søvn, nivå av stress og humør over en periode på én uke (september, uke 36). X-aksen viser dato for registrering….
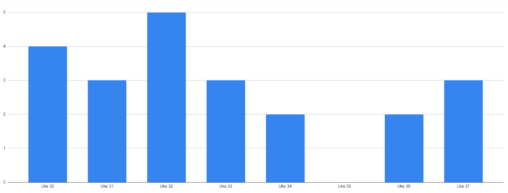
Hours worked out per week, for the last 8 weeks. Dips are from being sick and from having more work(employment).
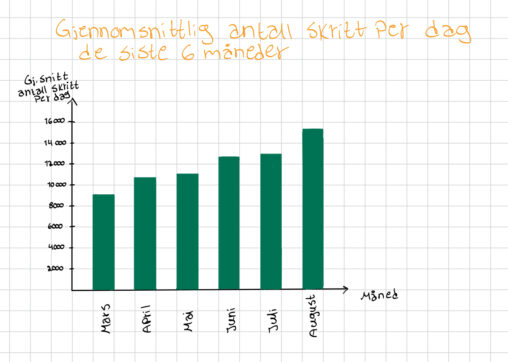
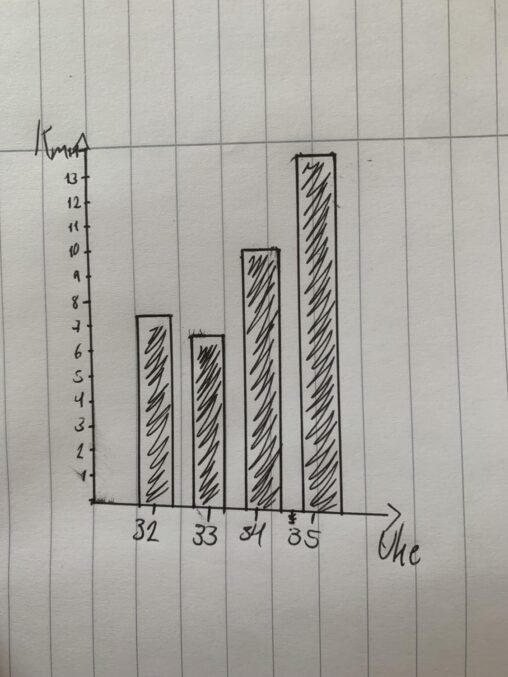
Gjennomsnittlig antall skritt per dag siste 6 måneder Y-aksen viser gjennomsnittlig antall skritt per dag, mens X-aksen viser måneden

Visualiseringen representerer antall skritt jeg har gått hver dag i uke 36
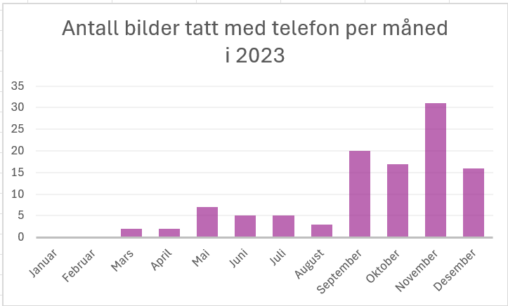
I grafen visualiseres antall bilder tatt per måned av meg med telefon i året 2023. Alle disse bildene fant jeg på bilde appen på telefonen.

Dette er hvor mange timer jeg har brukt på telefonen sist uke (uke 36). Visualiseringen er laget i excel.

I data visualiseringen ser man hvor mange nedbørs dager det var i Bergen per måned for året 2023. Langs x-aksen står månedene og langs y-aksen er antall nedbørs…

Here’s a pie chart illustrating how time is distributed across different apps during a typical day. Each colored segment represents the minutes spent on a specific app, providing…
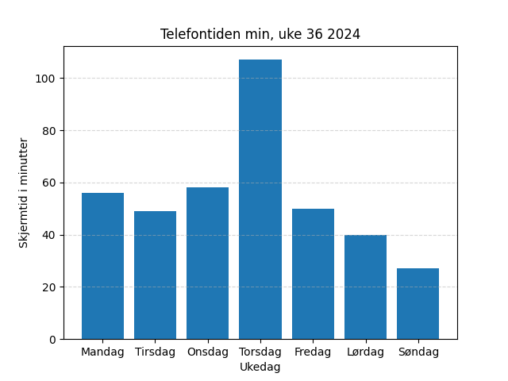
A simple visualization of mobile screen time in minutes (y-axis) per day of the week (x-axis) in a week in 2024. My own data. Public Domain.
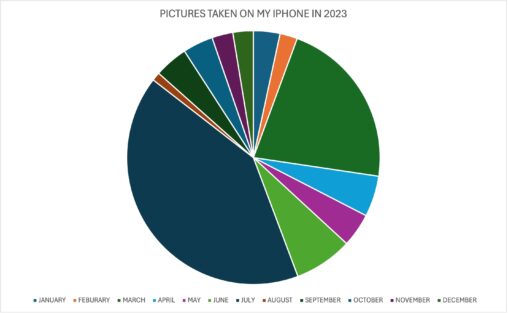
The number of pictures I have taken with my iPhone during each month of 2023. The two outlying months are March and July, this is due to me…

Hvor mange skritt jeg har gått i gjennomsnitt per dag i august måned hvert år siden 2019.
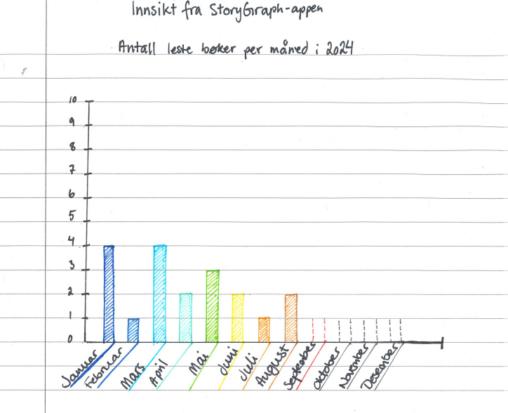
Antall bøker jeg leste i 2024, per måned. Data for september til desember er estimert, da statistikken tilsier at det vil bli lest minst en bok for hver…

Dette er data på hvor mange skritt jeg gikk hver av dagene i uke 36. Dataen er registrert av appen “Helse” på iPhone. Visualiseringen er laget i Excel.

Jeg avla min DNA profil i flere store databaser over hele verden, i letingen etter min ukjente far. DNA og innsamling av data fra mulige kandidater, og øvrige…

A stacked bar chart showcasing how many grams of protein, carbs and fat I ate in one specific week of my life. This week is nothing out of…
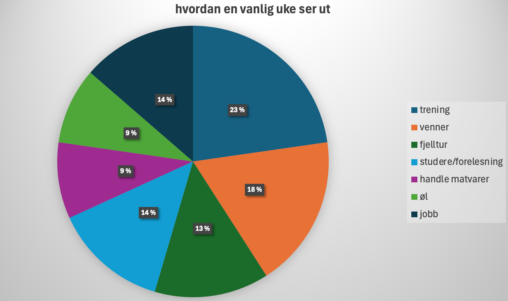
My average week in data. The stars indicates how many times a week I pursue the different activities. Different colored stars helps visualizing different types of activities (for…