
(page 7 of 157)
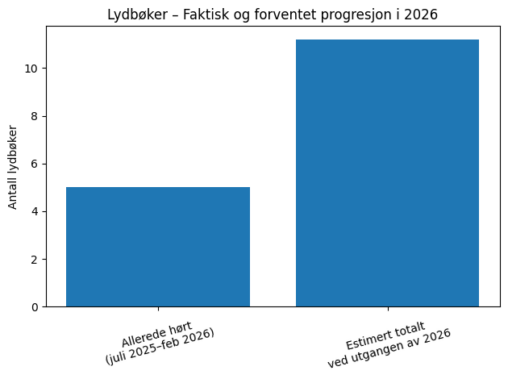
This is the data of number of books I’ve listened to with NRK “Leseklubben” from July 2025 to February 2026. This includes an estimate of how many books…
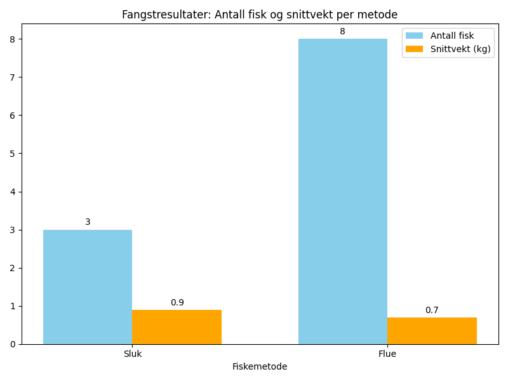
These are my recent results of my sea trout fishing in a Norwegian fjord
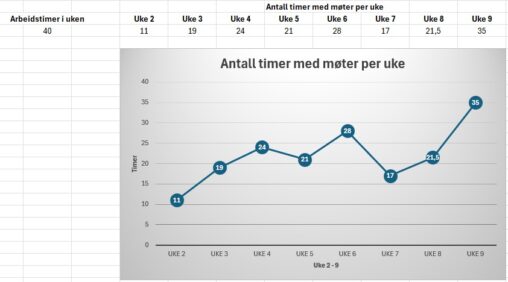
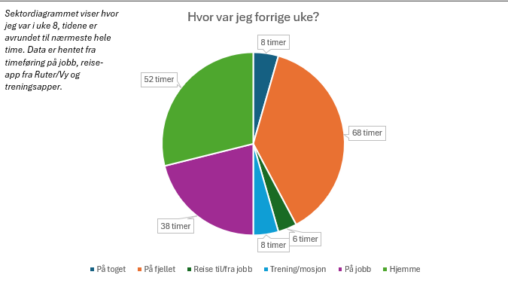
I’ve made this visualization based on how many hour’s I’ve spendt in a meeting each work week since the new year. The units are in hour’s and weeks….
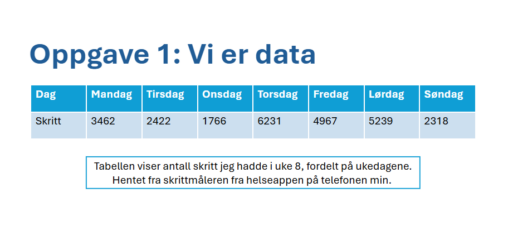
Tabellen viser antall skritt jeg hadde i uke 8, fordelt på ukedagene. Hentet fra skrittmåleren fra helseappen på telefonen min.

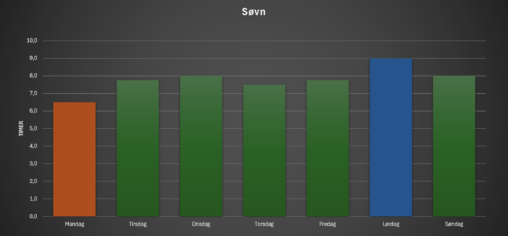
Skjermtid på PC angitt i timer per dag mandag til søndag en vanlig uke. Visualiseringen er gjort i Excel.
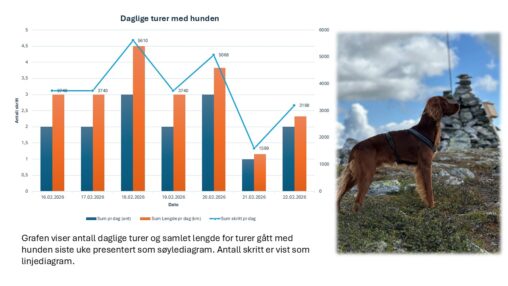
Grafen viser antall turer jeg har gjennomført med min hund i uke 8 (16-22 februar). Som stolpediagram vises antall daglige turer og antall kilometer. Som linjediagram vises antall…
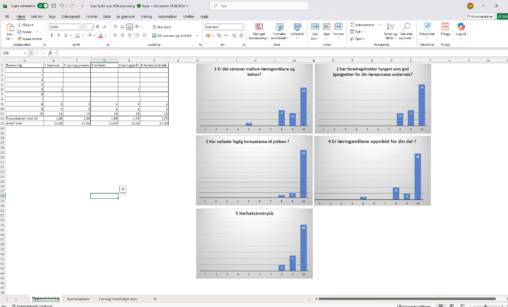
Data were collected from evaluation forms from 22 course participants after a 2‑day course in Berlin.
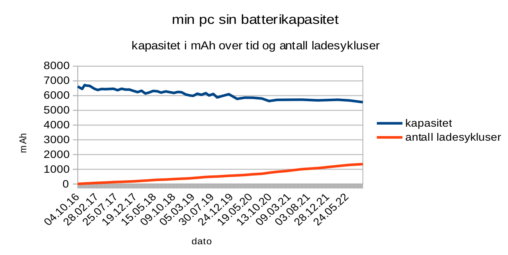
Utviklingen i min pc sin batterikapasitet fra den var ny over en bruksperiode av over flere år og 1200+ ladesykluser. Jeg eier dataene og har brukt LibreOffice til…
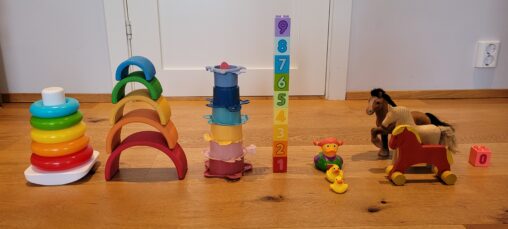
Number of times my daughter has woken me up during the night the seven last nights represented through her toys.
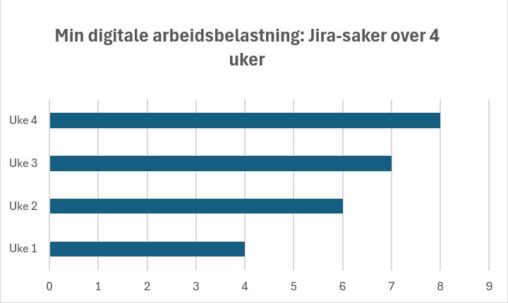
Jeg valgte å visualisere antall Jira-saker per uke fordi dette representerer min digitale arbeidsbelastning. Økningen fra uke 1 til uke 3 viser en tydelig intensivering av arbeidsmengde, før…
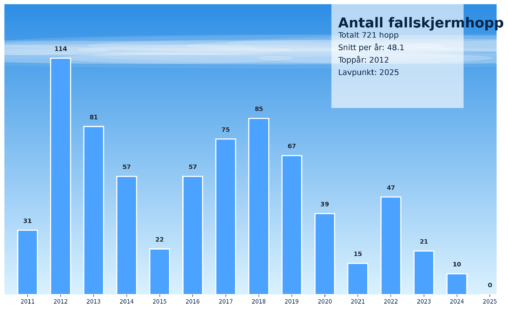
Figuren viser hvor mange fallskjermhopp jeg har hatt siden starten i 2011. Jeg eier disse dataene og jeg har brukt Microsoft Copilot til å lage figuren.
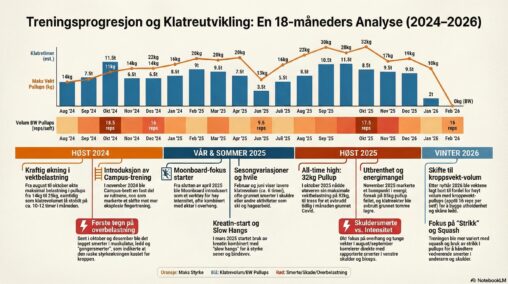
Visualization using graphs and text showing my development of strength in climbing-related exercises over time from fall 2024 to winter 2026. Includes periods with specialization, using tools such…
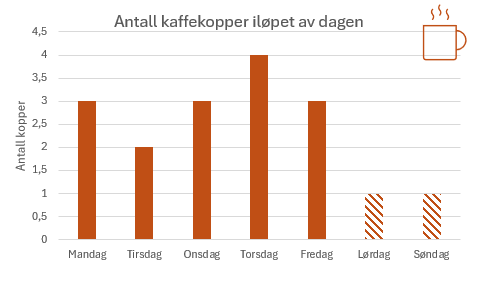
Diagrammet viser antall kaffekopper jeg drikker i løpet av en vanlig uke, fordelt per ukedag (mandag til søndag). Eget arbeid
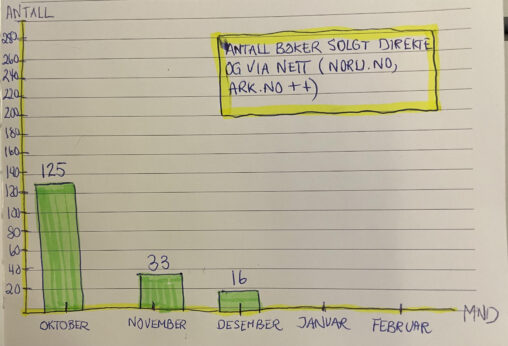
This data visualization presents the number of units sold of a self-published poetry collection per month during the fourth quarter (Q4) of 2025. The time period covered is…
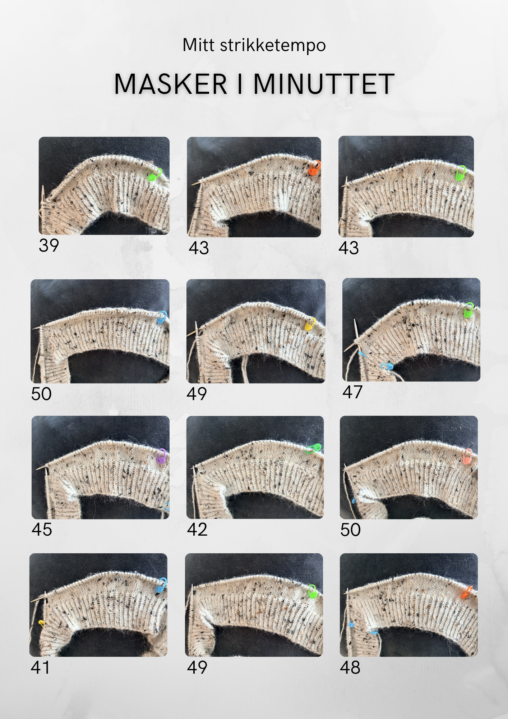
Jeg har satt nedtelling på et minutt, strikket og så telt hvor mange masker jeg har strikket i minuttet. Gjentok 12 ganger for å få riktigere data for…
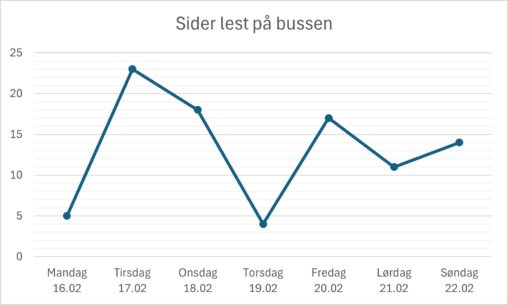
Jeg samlet data på hvor mange sider jeg leste av “Wuthering Heights” av Emily Brönte på bussen i løpet av en uke. Noen dager var det mer kø…
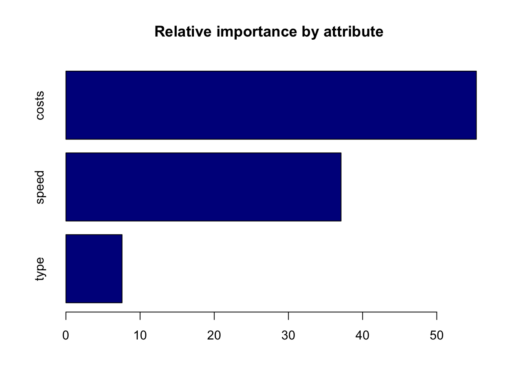
the data is supplied by the professor from course MBM 433 at NHH. the data contains the custormers age, gender, region, ID, and how customer choose the product…
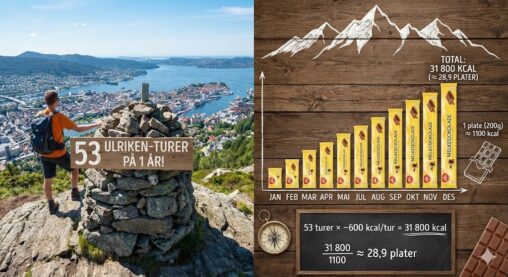
Figuren viser antall turer gått på Ulriken i 2025, målt i sjokoladeplater.