(page 4 of 157)

Jeg har en travel hverdag. Jeg reiser på forskjellige skoler i løpet av dagen og uken. Min hverdag består av reising, undervisning og venting på buss. Jeg har…
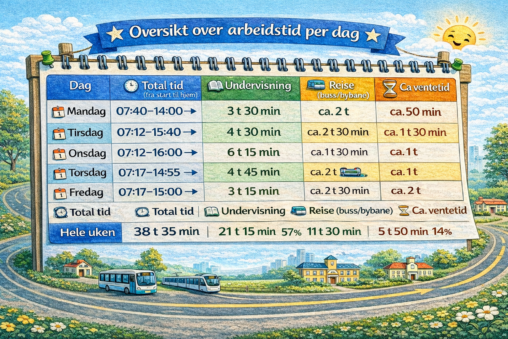
Jeg har en travel hverdag. Jeg reiser i løpet av dagen og uken til forskjellige skoler. Arbeidsuken min består av reising med buss, undervisning og venting på buss….
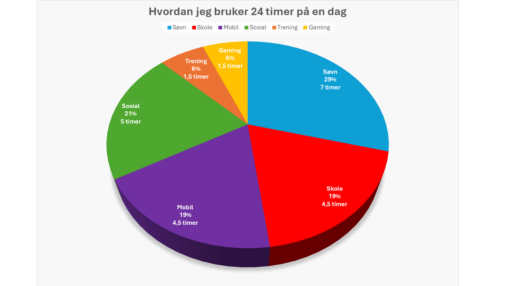
Visualiseringen viser at ila 24 timer, sover jeg mest (skulle gjerne vært 1 time lengre også, menmen), og er ganske sosial. Det verste jeg har på døgnet, er…
Eg hadde eit mål om å selje 100 ting i 2024. For å gjere det meir motiverande laga eg eit illustrativt skjema som eg hang på veggen, der…
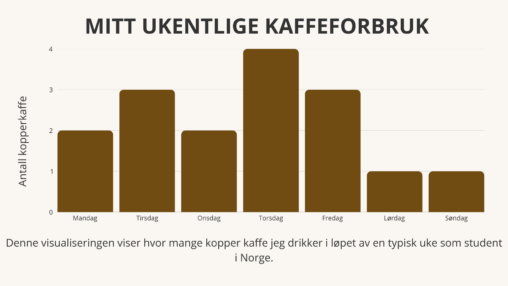
Denne visualiseringen viser antall kopper kaffe jeg drikker per dag i løpet av en typisk uke som student i Norge. Dataene er samlet inn manuelt og representerer mitt…
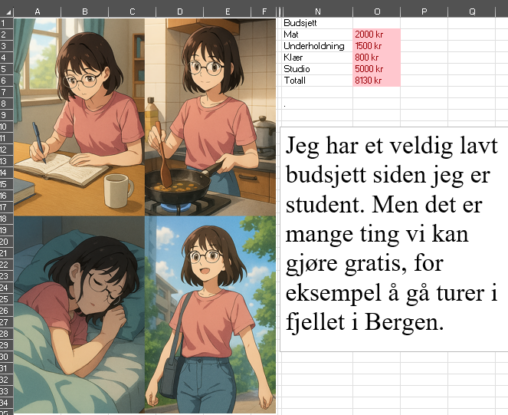
Den korte teksten er inspirert av studentlivet, både det økonomiske og hvordan vi kan være sosiale uten å bruke mye penger. “Jeg har et veldig lavt budsjett siden…
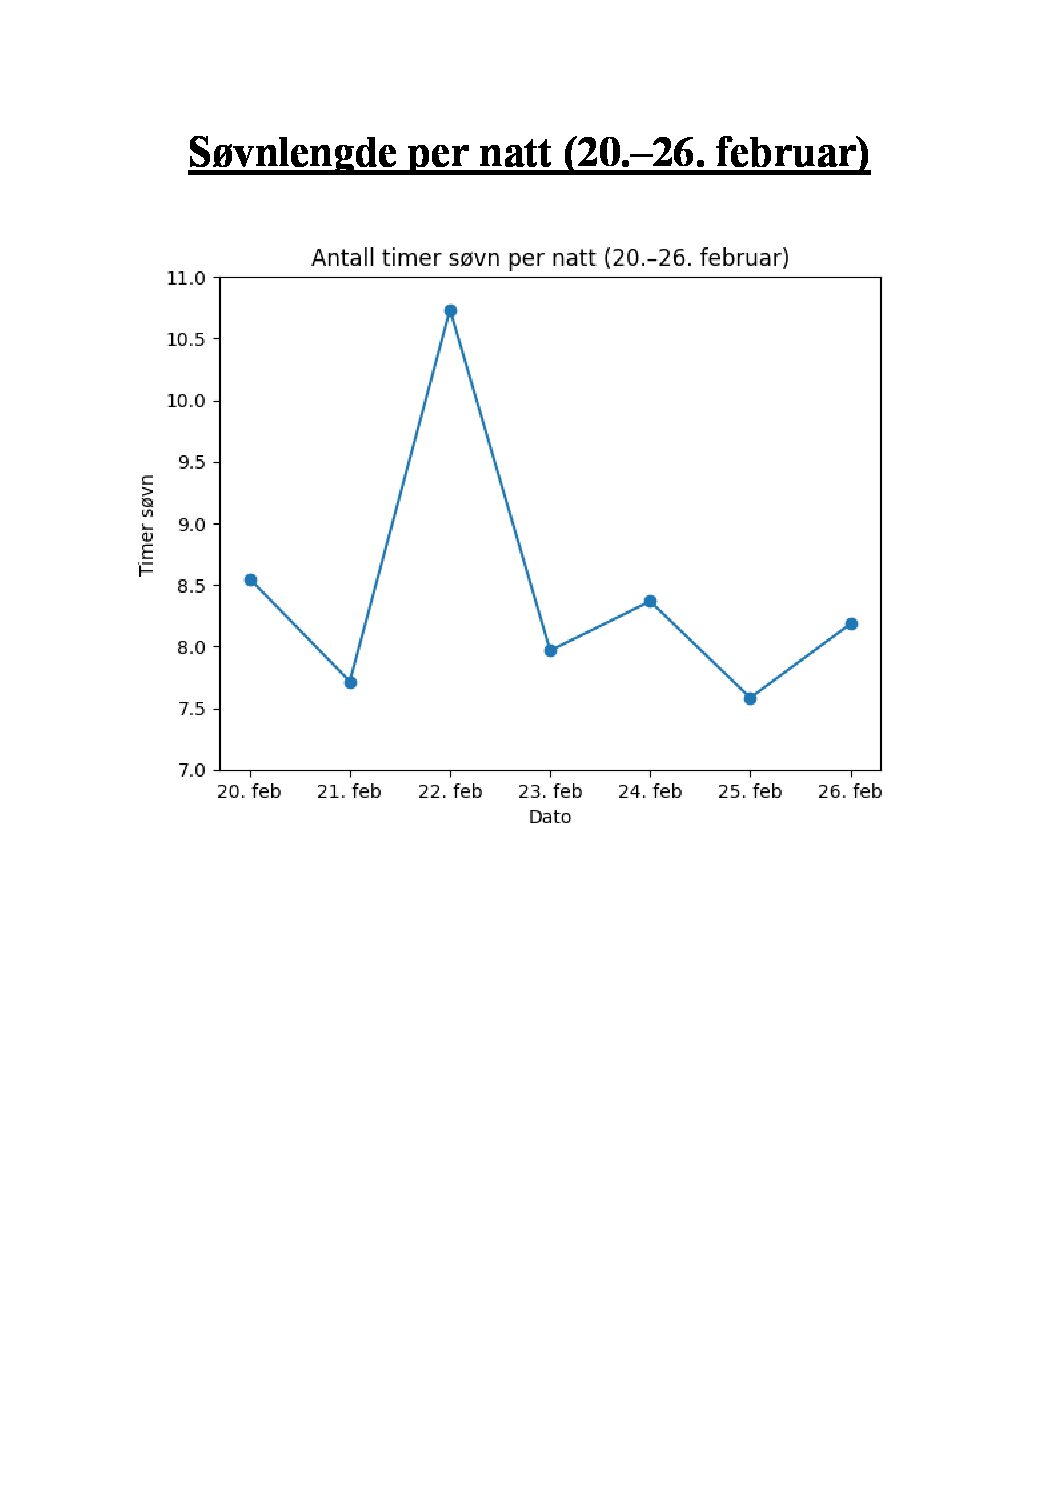
Visualiseringen viser en oversikt over egen søvnlengde i timer per natt i perioden 20-26 februar 2026.
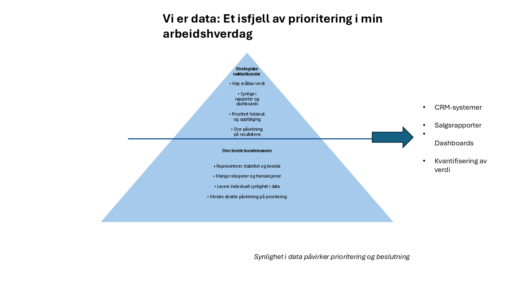
This visualization illustrates how sales data structures my professional practice as a sales manager in TESS. Inspired by the 80/20 principle, the iceberg metaphor represents how a small…
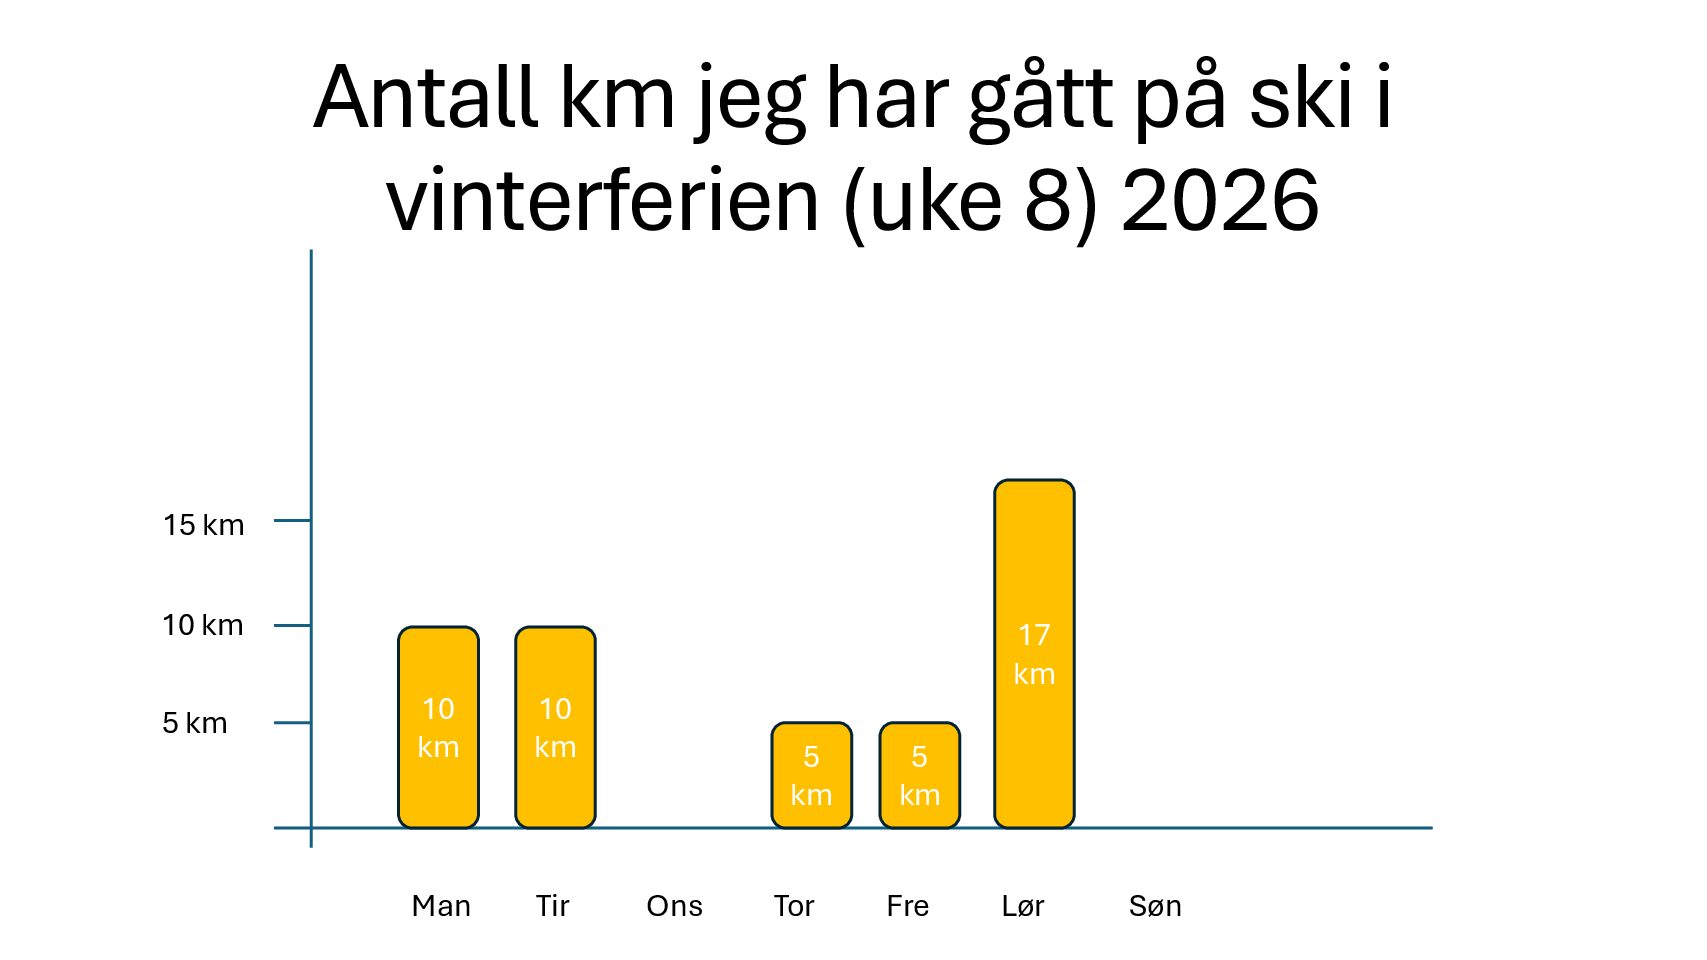
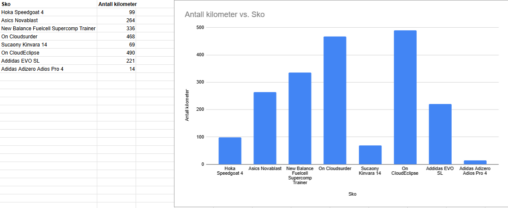
representation of Camilla Brodtkorb’s distance of cross country skiing during week 8 2026. By Camilla Brodtkorb
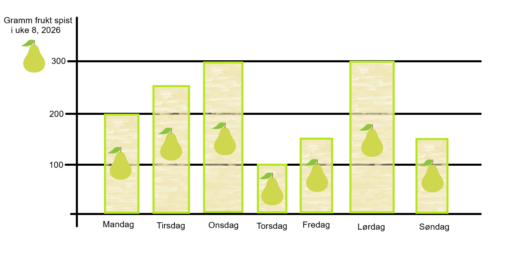
Dette er en visualisering av hvor mange gram frukt jeg har spist i uke 08 i 2026.
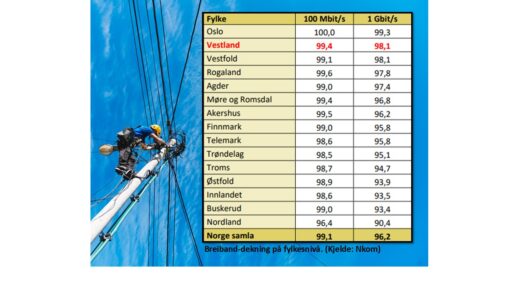
I Nkom si kartlegging er Vestland det fylket i landet – dersom ein ser bort frå Oslo – som har best breiband-dekning. Dette heng saman med at fylkeskommunen…
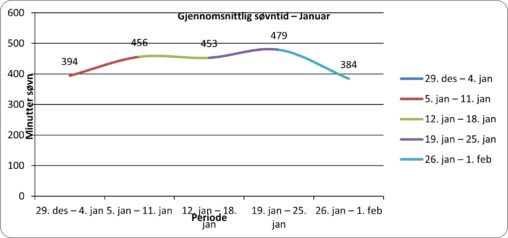
This visualization shows my average sleep duration per week from 29 December to 1 February, measured in hours and minutes. The data is presented as a line chart…
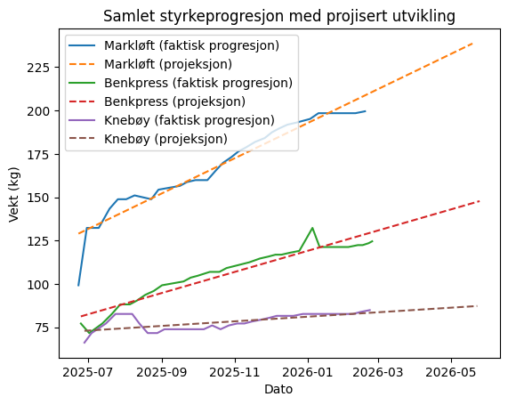
Min progresjon i benkpress, markløft og knebøy fra jeg startet styrketrening for 6 måneder siden.
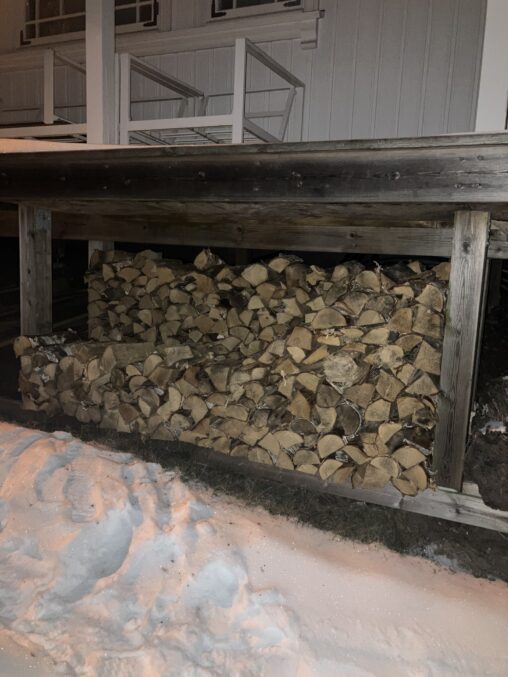
Wood left to heat up our house for the rest of the winter season 2026. Photo taken on February 10, 2026
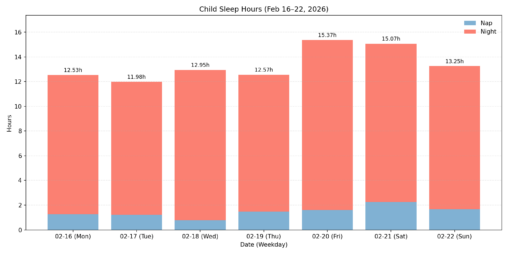
Detaljert beskrivelse: Denne visualiseringen viser hvor lenge sønnen min sov hver dag i perioden 16.–22. februar 2026, inkludert både middagshvil og nattsøvn. Søvntidene er oppgitt i timer og…

En mandag i mitt liv. På jobb, lage middag, trener på fotballen, og gift med en flott kone. Denne illustrasjonen er laget i Copilot.