
(page 36 of 157)
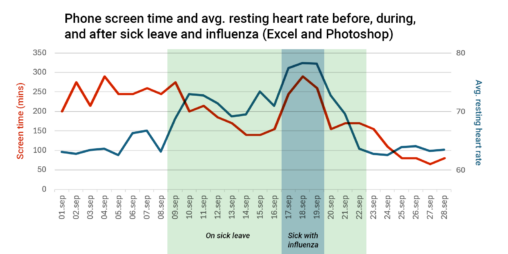
In September 2025, I was on a 14 day sick leave, during which I also fell ill with the flu for three days. When I looked at my…
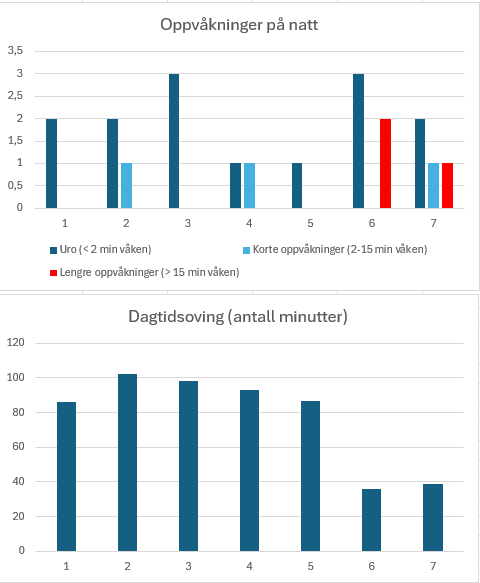
Som mamma til 1-år-gamle tvillinger er søvn en mangelvare. I uke 40 forsøkte jeg å få oversikt over antall oppvåkninger på natt (uro, korte oppvåkninger og lengre oppvåkninger)…
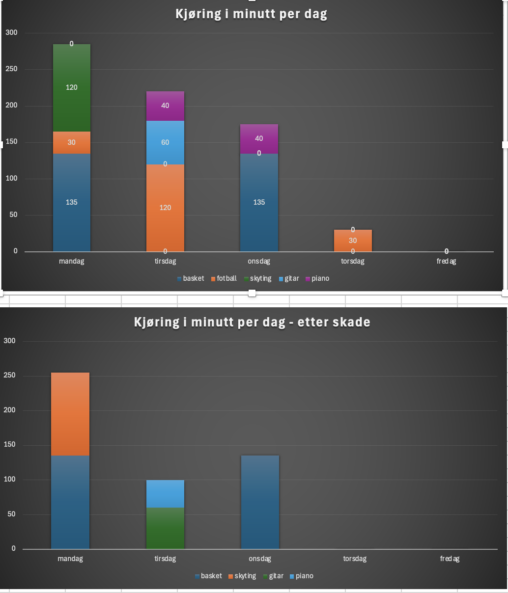
Med tre barn som har litt for mange aktiviteter, blir det mye kjøring. Flere av aktivitetene er i tillegg et stykke unna. Én av ungene brakk nettopp armen…
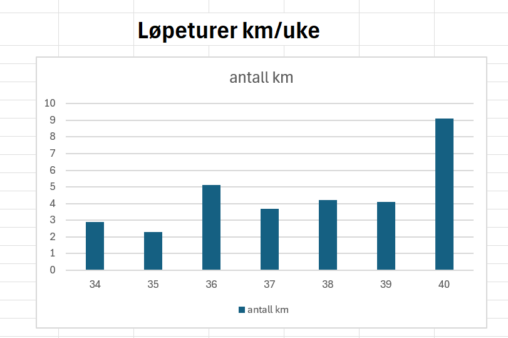
Stolpediagram for løpeturer antall km/uke Data hentet fra lagret data fra Connect-app (fra Garmin-klokka), diagrammet er laget i Excel. Diagrammet representerer utvikling av lengde løpeturer i period fra…
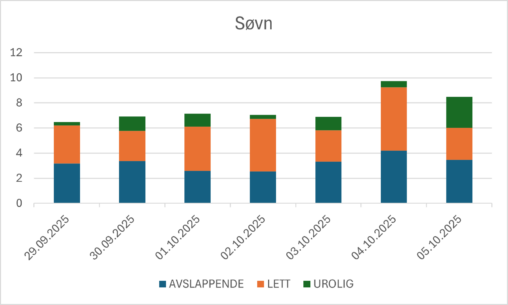
The record of different types of sleep during a week. I am the owner of the visualized data. Public domain. http://www.sleepquality.com/
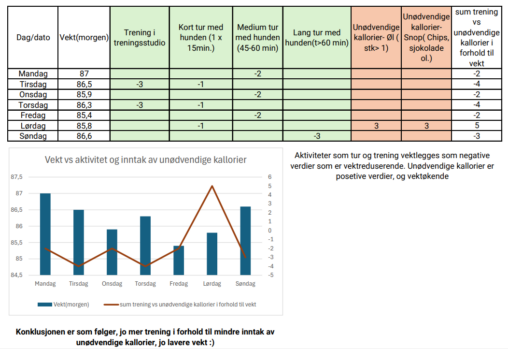
Vekt vs. aktivitet og inntak av unødvendige kallorier i løpet av en uke. Konklusjonen er som følger, jo mer trening i forhold til mindre inntak av unødvendige kallorier,…
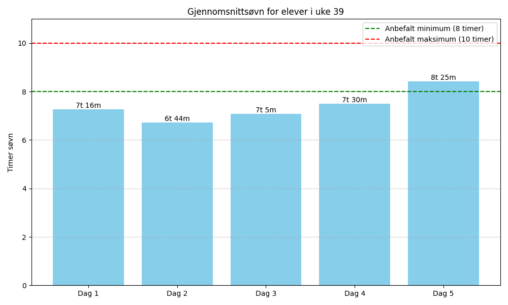
Anbefalt søvn for ungdom er 8-10 timer i døgnet. 18 elever i aldersgruppen 16 – 18 år har målt sine søvnvaner i løpet av fem døgn i uke…
Data fra apper tilknyttet matvarebutikker, og min bruker. Antall handleturer Dato periode
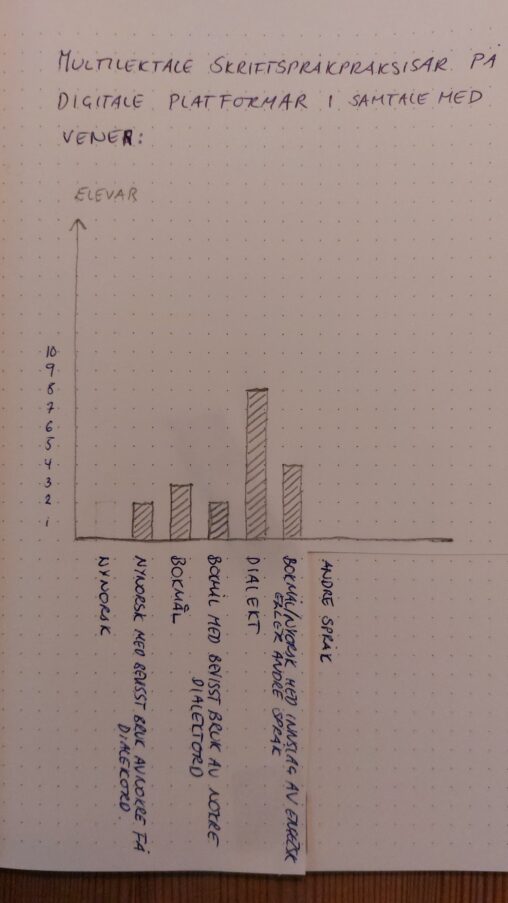
Diagrammet viser kva elevar svarer på spørsmålet “Når du chattar eller skriv sms til vener, kva språk brukar du? (Svar det du brukar mest)”
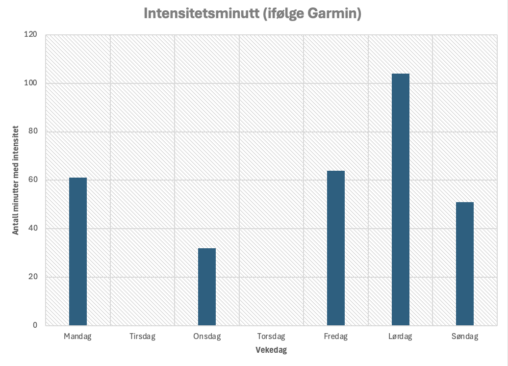
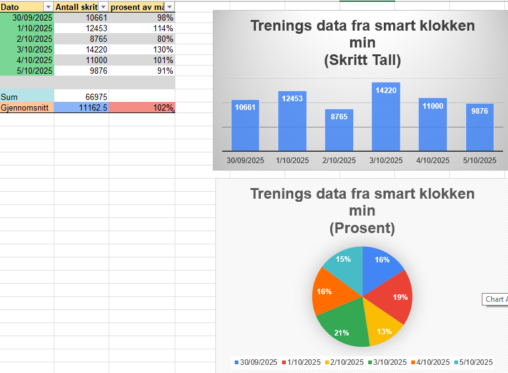
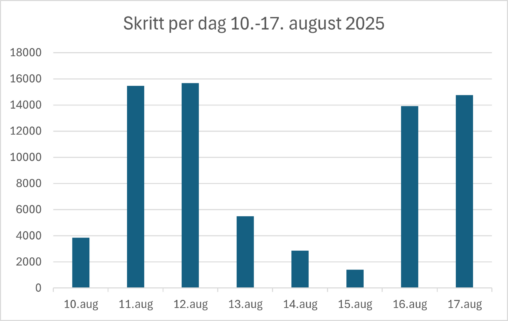
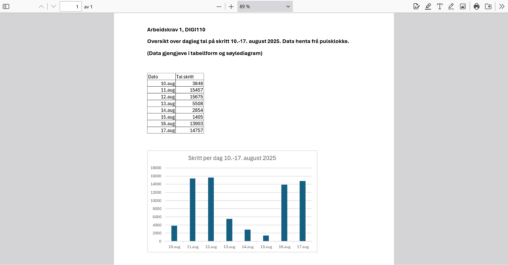
Viser hvor mange intensitetsminutter eg hadde kvar dag i veke 39. Data er samla inn ved hjelp av pulsklokke, og tala er henta frå appen til Garmin. Visualiseringa…

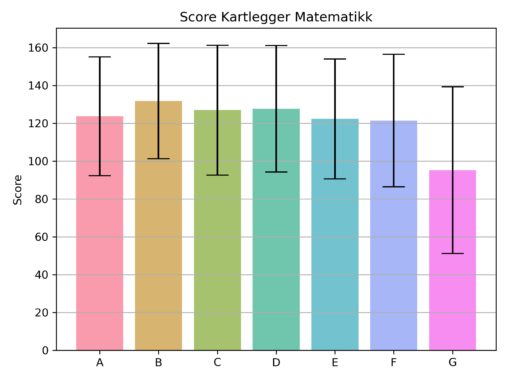
Diagrammene viser ulike førsteklassers score på kartleggingstesten i matematikk. Resultatene presenteres som gjennomsnitt med standardavvik
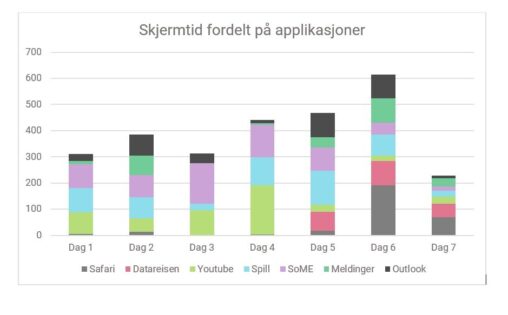
Skjermtid i minutter per dag, fordelt på ulike applikasjoner. Stolpediagrammet er laget i word.
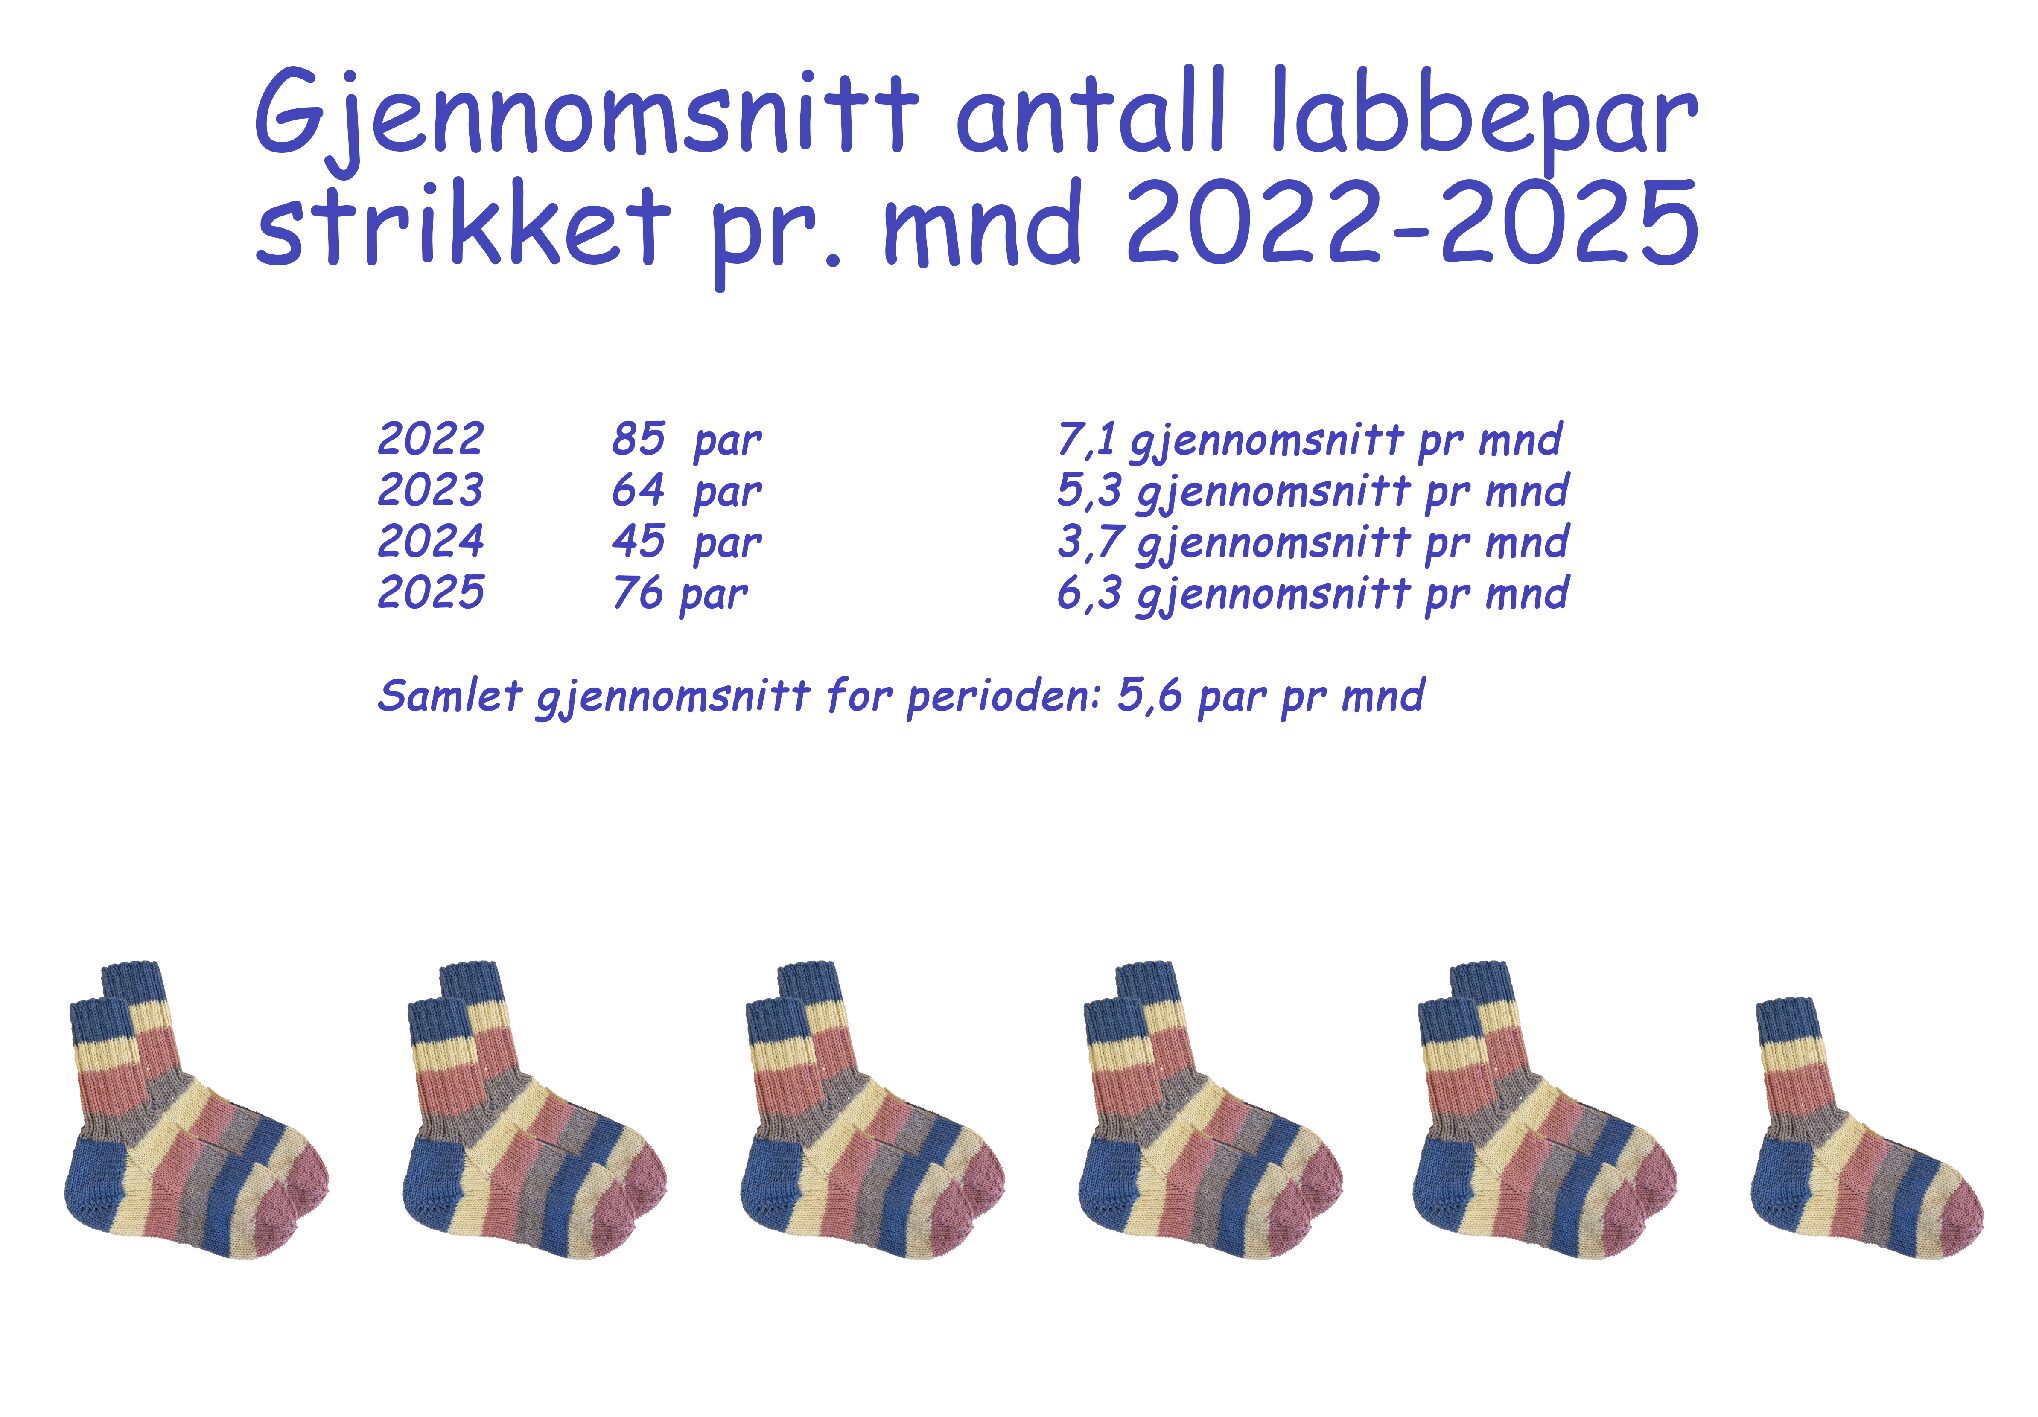
Jeg stikke mange labber og selger disse labbene til en liten butikk. I den forbindelse har jeg et eget lite regnskap over hvor mange labber jeg har solgt…
Eg er veldig glad i film, og bruker ein app som heiter Letterboxd, der ein m.a. kan logga kvar film ein ser på den datoen ein ser han….