
(page 35 of 157)
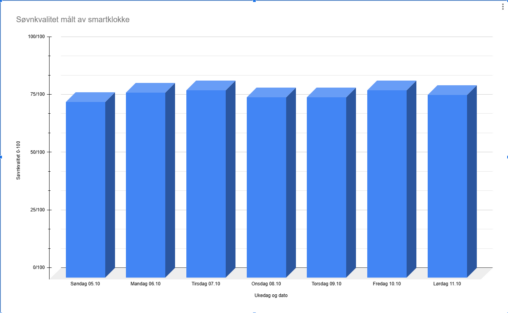
It is a representation of sleepquality measured by a smartwatch during a week (Sunday – Saturday). Data collected by a private person. Owned by user of watch, through…
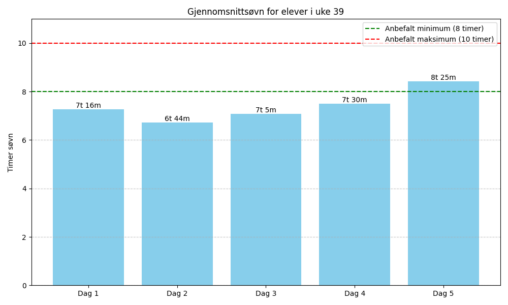
I faget Helsefremmende skulle 17 elever måle søvnvaner i 5 valgfrie døgn i uke 39. Aldersgruppen er 16 – 18 år. I følge læreboken =HO Helse, Vg1 Helse-…
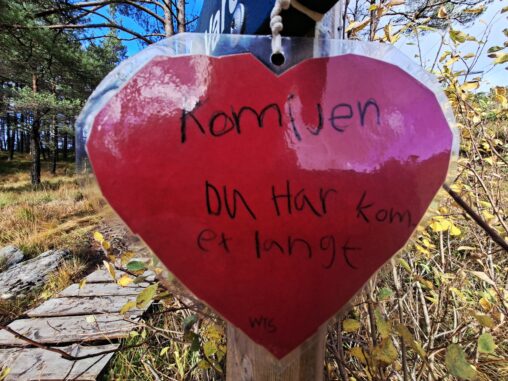
Picture taken outdoors by me, on a path in the woods 12.10.25
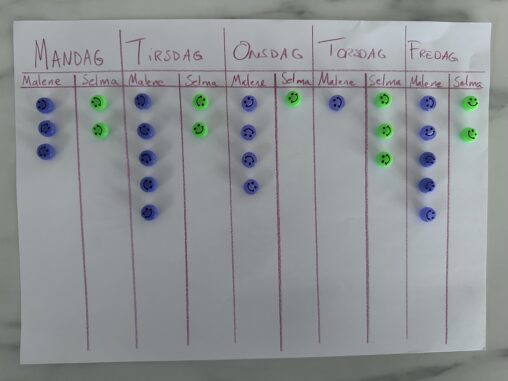
Number of times I have to tell my kids to brush their teeth in week 40. Each bead represent me asking them to brush their teeth. Copyright: Creative…
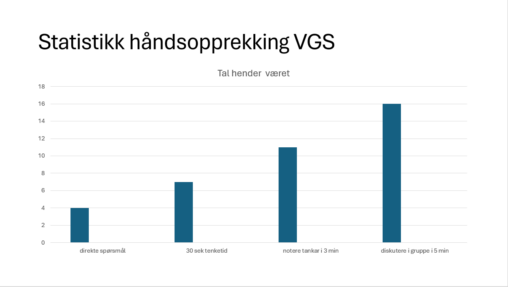
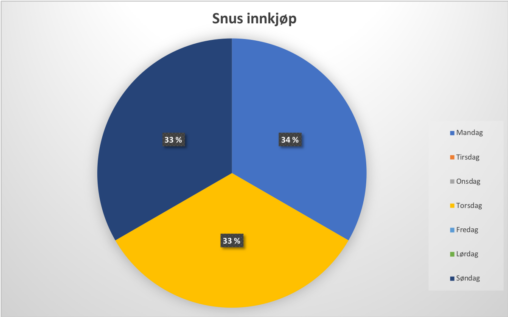
Respons frå elevane mine med ulike metodar. 30 elevar i klassen. Konklusjon: Direkte spørsmål, altså den klassiske metoden der lærar spør klassen “ut i lufta” og peiker på…
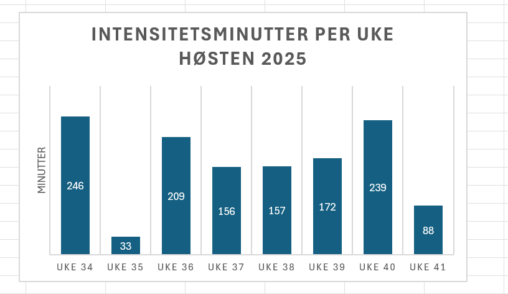
These are data of intensity minutes per week collected by myself and my watch the last eight weeks.
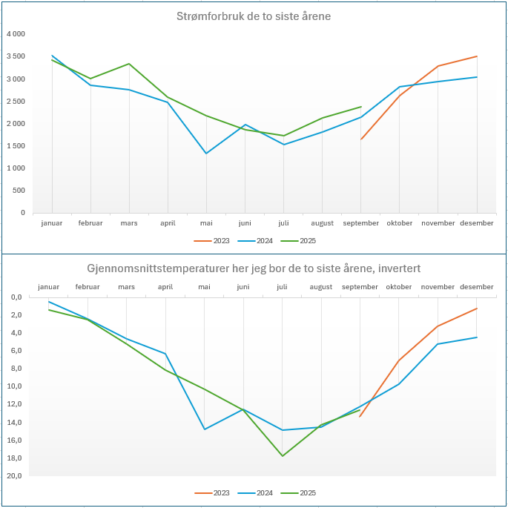
Strømdata hentet fra BKK, gjennomsnittstemperatur hentet fra Yr. Data skrevet inn i Excel for visualisering. Temperaturskalaen er invertert for å lettere se om det er noen direkte kobling…
Respons frå elevane mine med ulike metodar. 30 elevar i klassen. Konklusjon: Direkte spørsmål, altså den klassiske metoden der lærar spør klassen “ut i lufta” og peiker på…
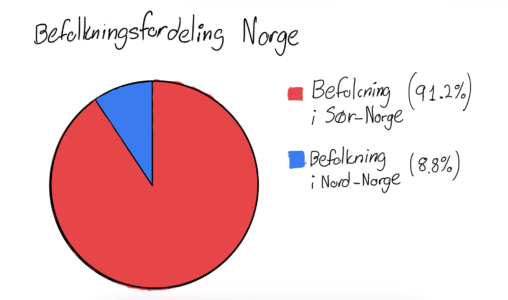
Visual representation of data describing the population spread of Northern/Southern Norway
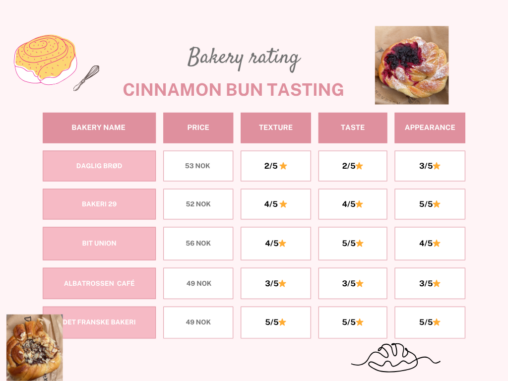
This is a rating of Cinnamon Buns in 5 of Bergens Bakeries. The image is created with Canva.com
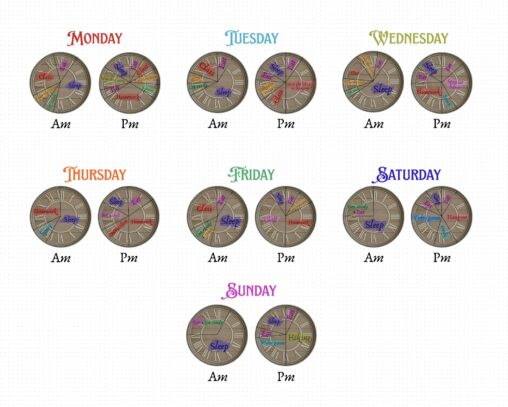
This is my routine in a week. I represented it through the clock in my parents’ living room that I took a picture of and then I separated…
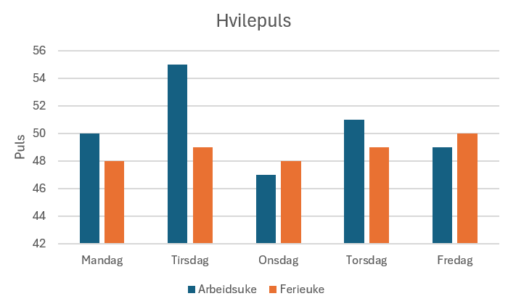
Visualiseringen viser hvilepuls (antall puls per minutt) målt når jeg våkner i ukedagene, i hendholdsvis en arbeidsuke (uke 40) og en ferieuke (uke 41) i år 2025.
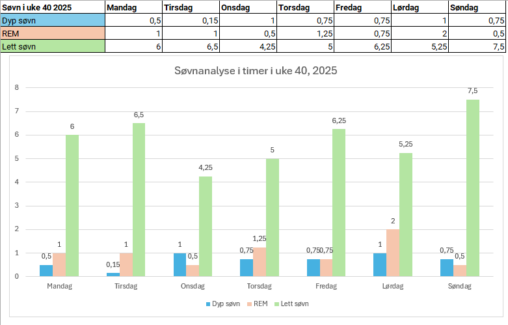
Søvn analyse i timer, i uke 40 2025. Hvor mange timer med REM, dyp eller lett søvn ble det denne uken.
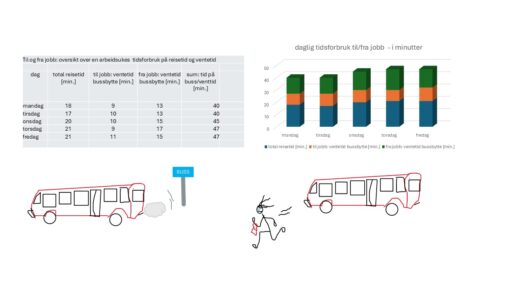
En ukes daglige tidsforbruk (i minutter) på bussreiser, inkludert ventetid ved bussbytte.
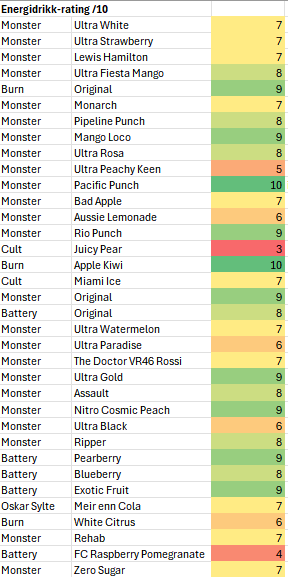
Vurdering av energidrikker på en skala fra 1 (verst) til 10 (best) basert bare på smak. Har brukt betinget formatering i Excel for å gi en fargeskala fra…
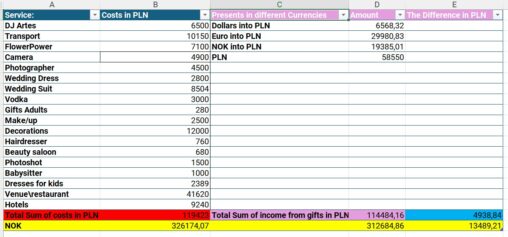
In the Excel file, I presented the details of the wedding costs as well as the income from gifts (we asked only for money). At the end, I…
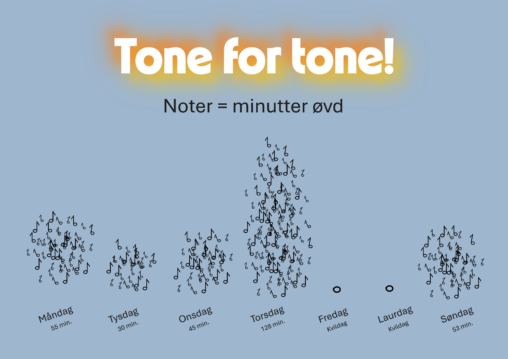
Dette er ein visualisering av minutter øvd på instrument i løpet av ei veke. Kvar note representerer eit minutt øvingstid. Illustrasjonen er delt er med Creative Commons lisens,…
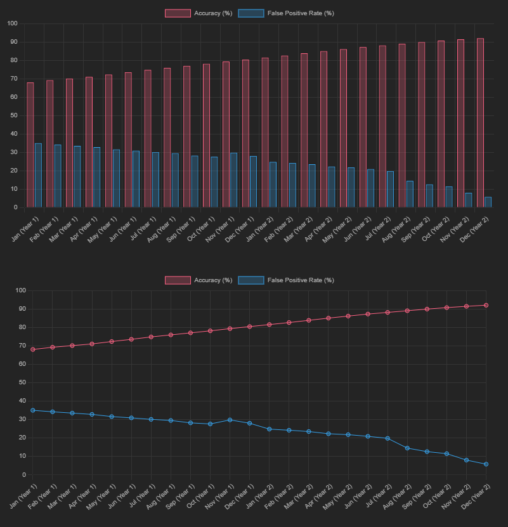
Denne grafen viser den månadlege ytinga til ein modell eg har laga for å oppdage phishing epostar. Nøyaktigheit og falsk positiv rate er viste, og syner kor effektivt…

I am only representing my personal data based on my wedding costs and income from gifts (gifts were only in the form of money: cash, bank transfer).