
(page 26 of 157)
Data viser hvor mange frukt og grønnsaker spiser en person hver dag i løpet av en uke.
Data viser hvor mange frukt og grønnsaker en person spiser hver dag i løpet av en uke.
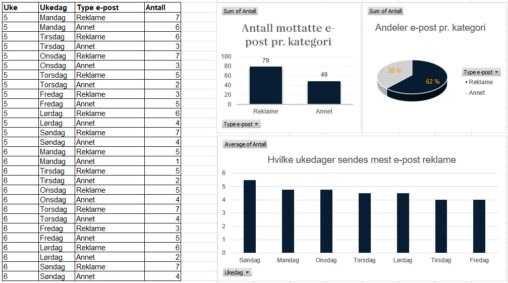
The data table and visualization represents received e-mails in private inbox over two weeks. The data set includes week, weekday and type of e-mail in categories Advertisement and…
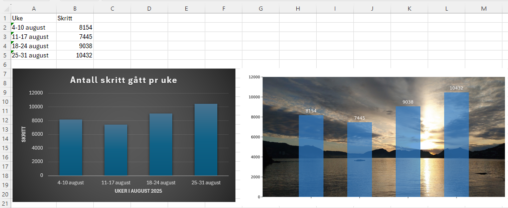
Søylediagram som viser antall skritt gått pr uke i august. 4-10 august 8154 skritt, 11-17 august 7445 skritt, 18-24 august 9038 skritt, 25-31 august 10432 skritt. Eier av…
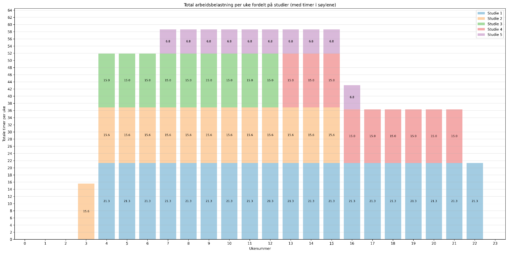
Spring 2026, the spring of studies! Jeg har meldt meg opp i fem ulike emner/studier denne våren. De har ulike studiepoeng, starter og avslutter på ulike tider. Jeg…
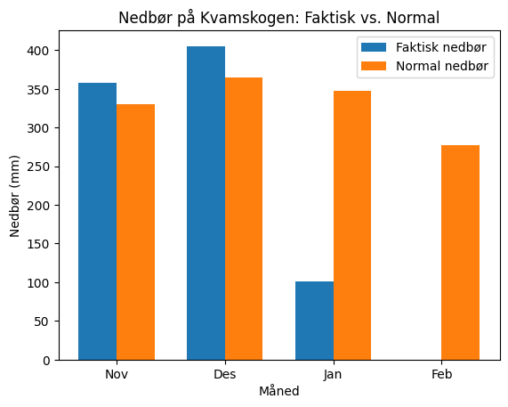
Visualiseringen viser at nedbøren på Kvamskogen var høyere enn normalen i november og desember 2025, mens januar og februar 2026 hadde betydelig lavere nedbør enn normalen.
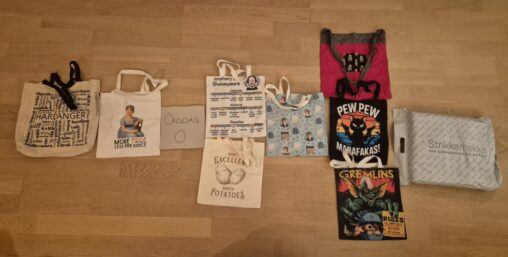
Illustrasjon av mine handleturer forrige uke, både i butikk og på Internett, illustrert med mine handlenett.
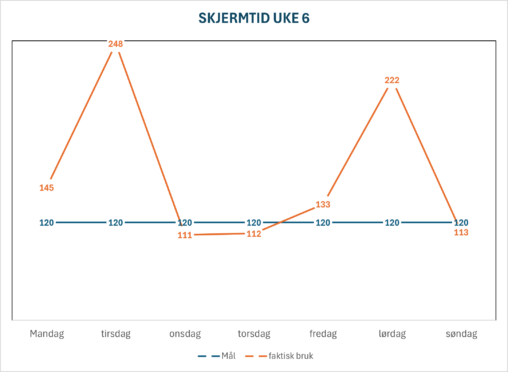
Oversikten viser skjermtid for uke 6 og overforbruk (mål: maks 120 minutter pr. dag).
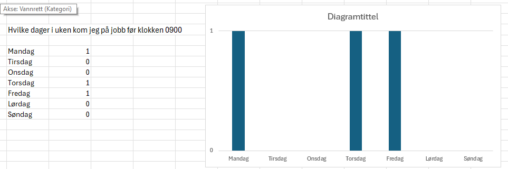
Hvilke dager jeg kom på jobb før klokken 0900 i uke 6. 1 betyr før 0900 0 betyr etter 0900
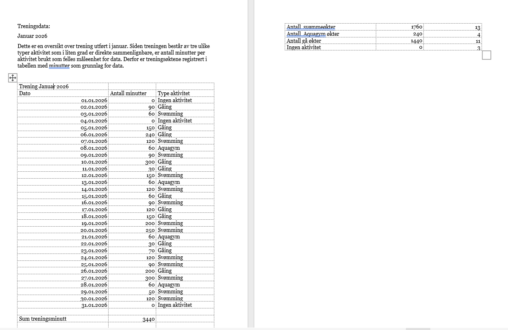
Dette er en oversikt over trening utført i januar. Siden treningen består av tre ulike typer aktivitet som i liten grad er direkte sammenlignbare, er antall minutter per…
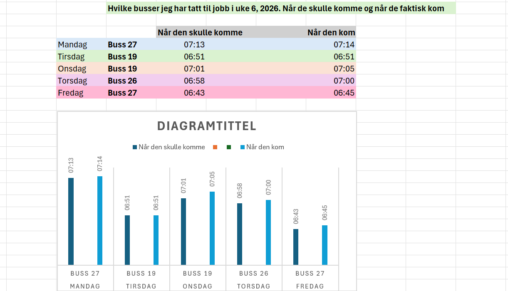
Busser jeg har tatt til jobb siste uke. Når de faktisk skulle komme basert på data fra skyss.no og når de faktisk kom basert på egen klokke, både…

Dette er en oversikt over trening utført i januar. Siden treningen består av tre ulike typer aktivitet som i liten grad er direkte sammenlignbare, er antall minutter per…
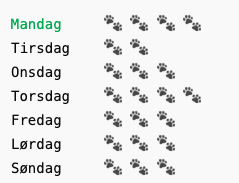
Denne visualiseringen viser hvor mange turer jeg går med hunden hver dag i løpet av én uke. Dataen er samlet manuelt og representerer en viktig del av hverdagen…
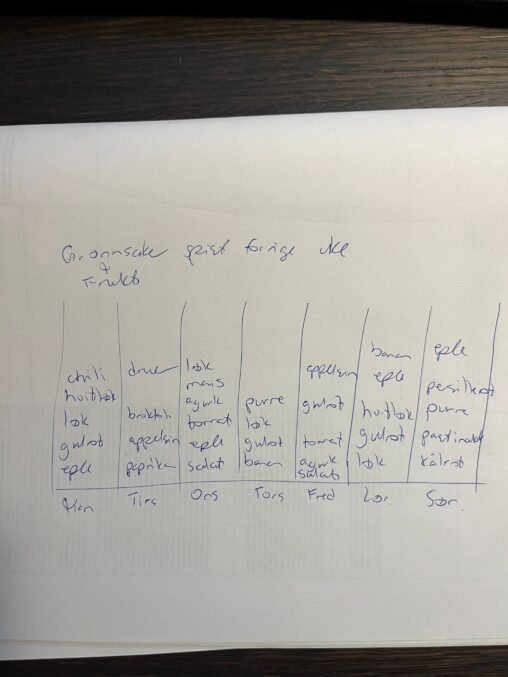
Jeg har tegnet manuelt en oversikt over hvilke grønnsaker og frukt jeg har spist hver av dagene man-søndag forrige uke.
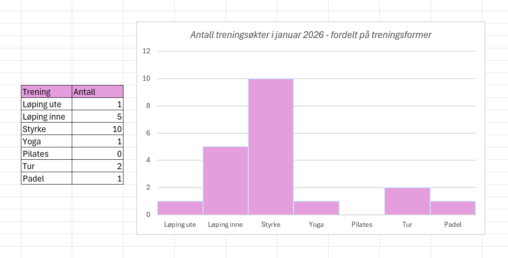
Dette er en oversikt av treningsøkter i januar 2026, fordelt på de ulike treningsformene jeg bruker.
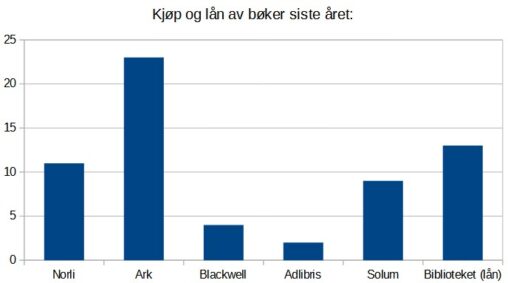
Diagram med seks søyler som visualiserer kjøp og lån av bøker det siste året. Seks søyler er: Norli 11, Ark 23, Blackwell 4, Adlibris 2, Solum 9 og…