
(page 18 of 157)
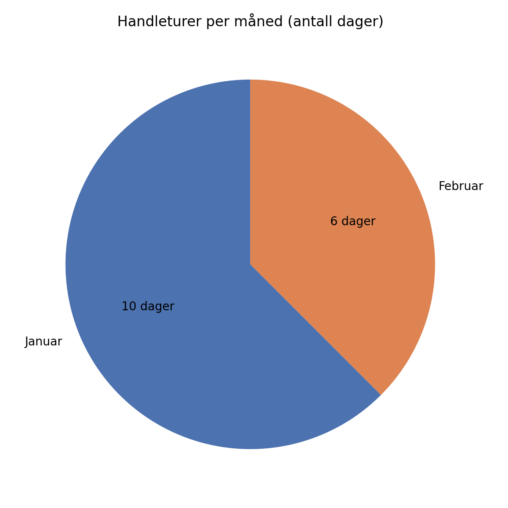
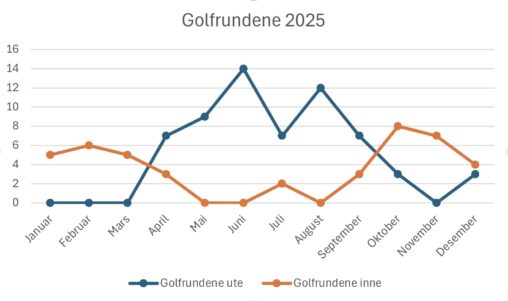
Sirkeldiagrammet ovenfor viser mine handleturer til en dagligvarebutikk så langt i år. Det blå feltet viser at jeg handlet på ti av dagene i januar. Februar er ikke…
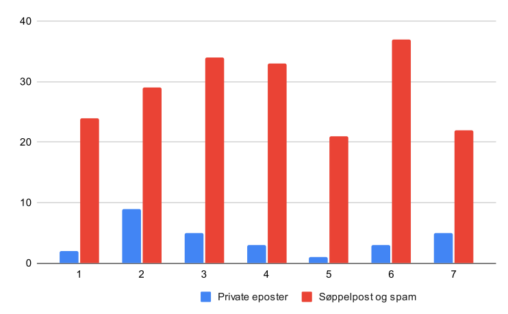
Diagrammet viser all innkommende e‑post til min Gmail‑adresse i løpet av én uke. Jeg opplever ofte at store deler av e‑postene jeg mottar er uinteressante eller uønskede, og…
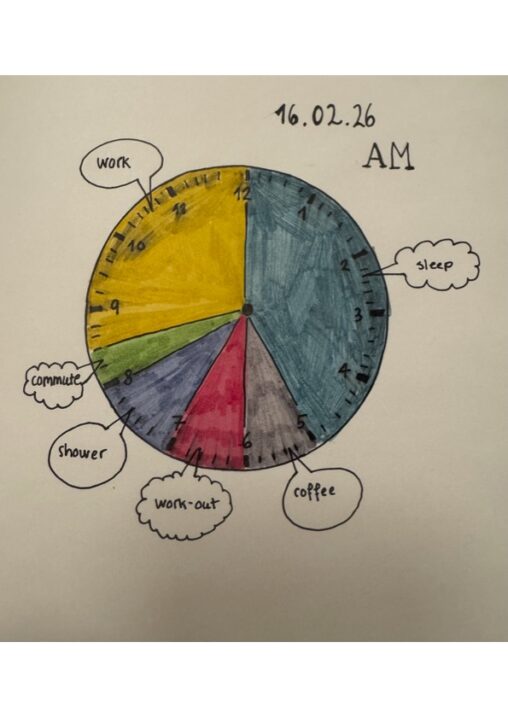
This clock represent how I spent my time on the 16th of February 2026 from 00:00 to 12:00 AM.
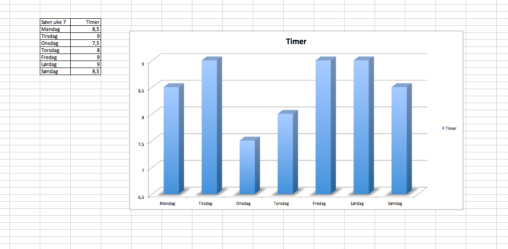
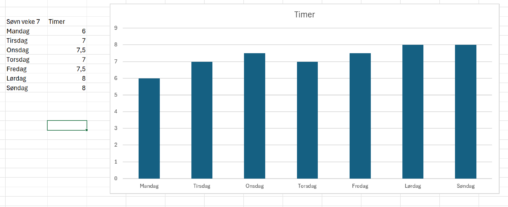
Det er en oversikt over hvor mange timer jeg såv hver natt i uke 7. Dagene er nede på diagrammet. Jeg har delt de inn i hele og…
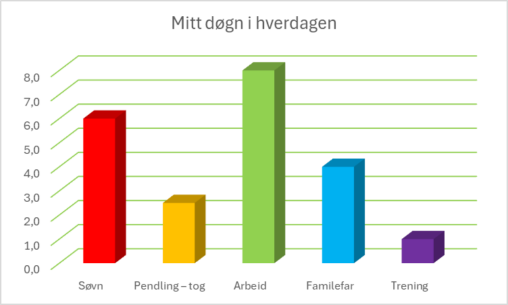
Dett er et excel-diagram som viser min typiske mandag. Dataene der laget av meg selv, og generert diagram i excel.
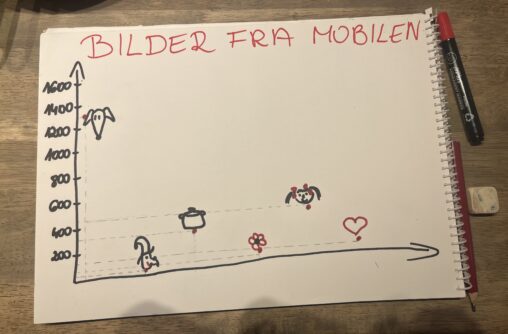
Omtrentlig antall bilder tatt med min mobil siden 5.01.2020 fram til i dag (16.02.2026), fordelt på mest fotograferte personer/objekter. – min hund 1333 – min søster 20 –…
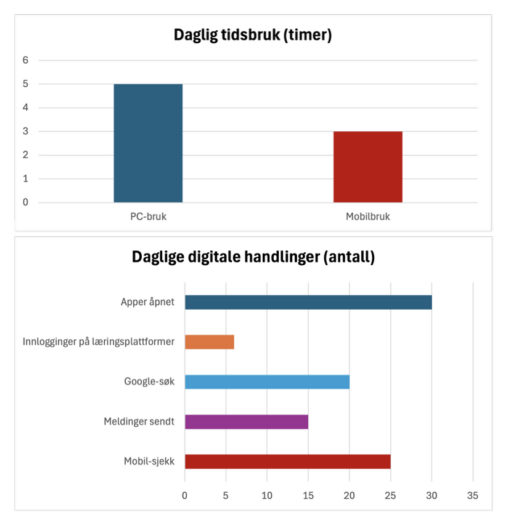
Denne visualiseringen viser en gjennomsnittlig digital studiedag basert på egenregistrerte data. Den første figuren viser daglig tidsbruk i timer på PC (5 timer) og mobil (3 timer). Den…

Datoer i januar hvor jeg har sett NUFC spille. Antall timer pr dato og fargekoding for å differensiere mellom ulike strømmetjenester.
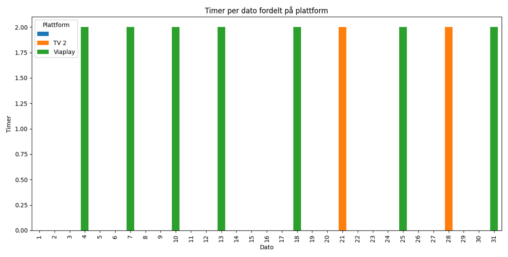
Grafisk fremstilling av hvilke dager jeg har sett NUFC spille i januar og hvor mange timer. Fargekoding for å vise hvilke strømmingstjenester som er benyttet. Excel er benyttet…
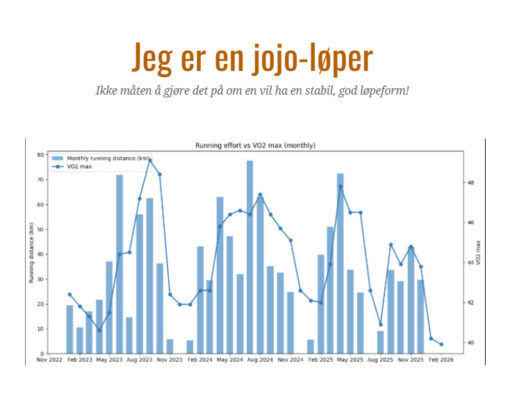
Bildet viser en grafisk fremstilling laget av ChatGTP med utgangspunkt i en csv fil med alle løpeøktene mine de siste 3 årene og en csv fil med variasjonene…
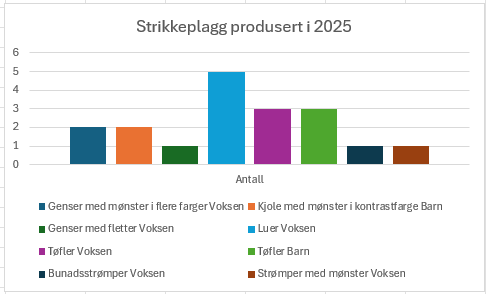
Jeg er veldig glad i å strikke og holder ofte på med det på fritiden. Det er gøy å føre oversikt over hva jeg strikker i løpet av…
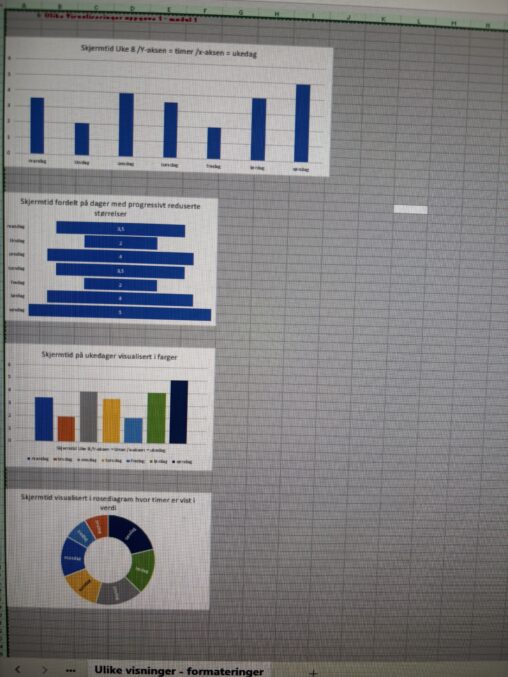
Visualisering av skjermtid i timer pr dag i uke 8

Visualisering av skjermtid brukt i uke 8 fordelt på ulike fremvisningsforslag/diagrammer

Jeg bruker Excel for å lage oversikt over strikkede plagg som jeg lager i løpet av et år. Jeg blir like overrasket hvert år over antall plagg i…
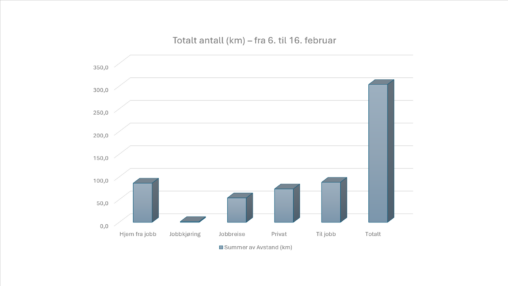
Digram over antall kilometer i løpet av 10 dager fordelt på ulike kategorier.
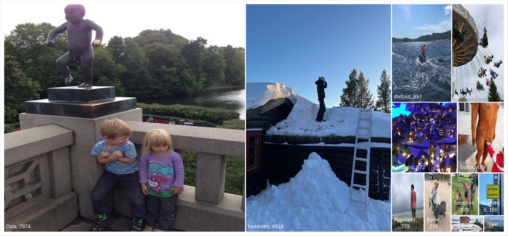
Flateproporsjonal vising av antall bilder tatt i hver fylke.
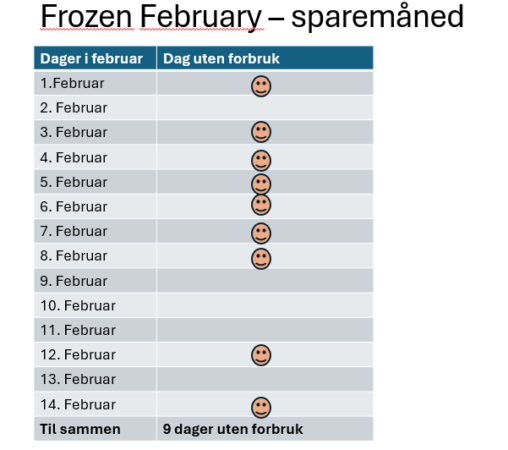
Frozen February – et sparekonsept der man i løpet av en måned skal ha et lavest mulig forbruk. Jeg viser med dette resultatene fra de to første ukene…
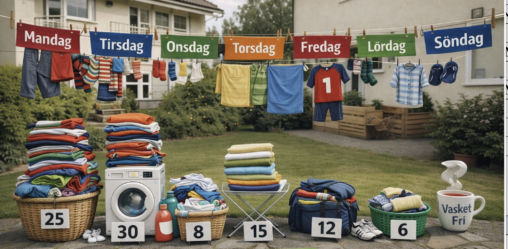
Som småbarnsfamilie bruker vi mye tid på klesvask hver uke. Her er en illustrasjon av antall klesplagg vasket i uke 7. Illustrert ved hjelp av KI.