
(page 16 of 157)
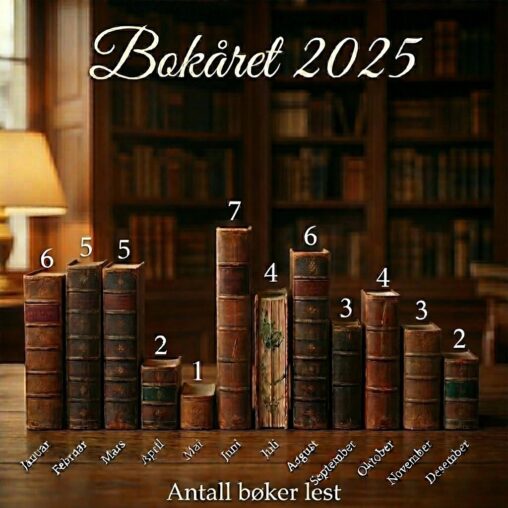
This is an overview of the number of books I read in the year 2025. I took my library loan history (the “bibliofil” app) as a starting point,…
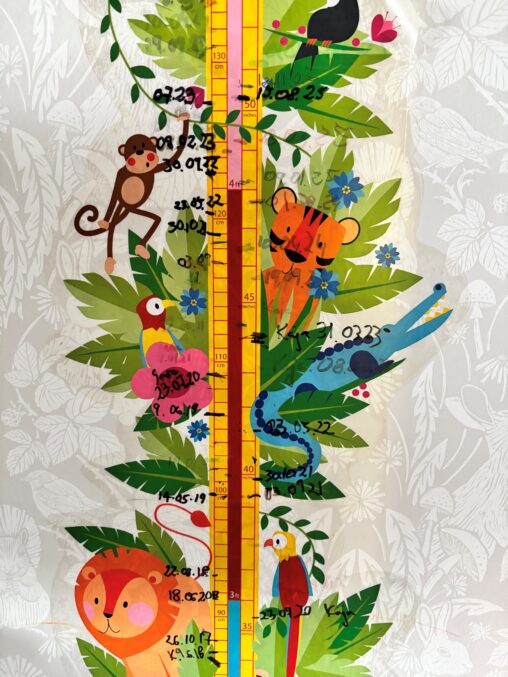
Data visualisation inneholder et bilde av høydemålingene gjennomført de siste årene på mine to døtre. Den inneholder dato for måling og høyde av S. sine målinger til venstre…
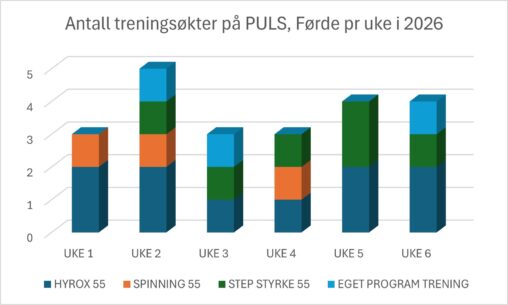
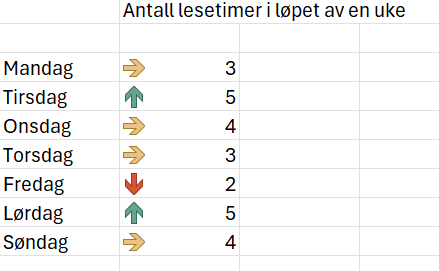
Mine egne data med oversikt over hvilke treningstimer jeg har deltatt på pr uke hittil i 2026
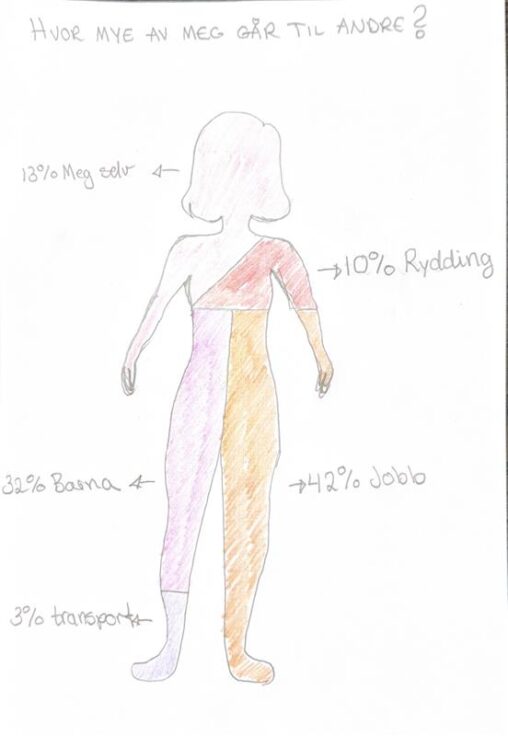
Hvor mange prosent av en uke – minus søvn bruker jeg på andre/andre ting enn meg selv.
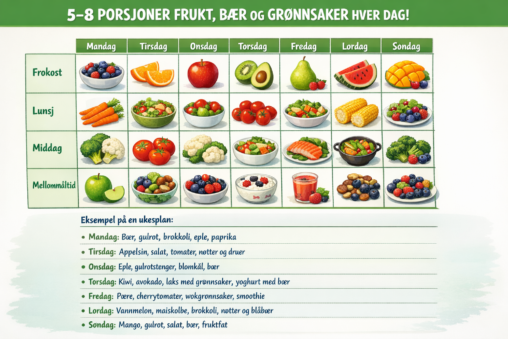
Helsedirektorates anbefaling for voksne mennesker er 5-8 porsjoner grønt/frukt per dag. Jeg prøvde å gjennomføre dette en uke og la inn hva jeg spiste av frukt og grønt…
Open Goverment Licence
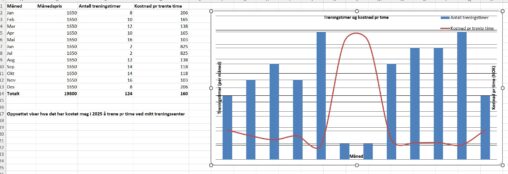
Bildet viser kostnad pr time trent ved å ha abonnement på treningssenter
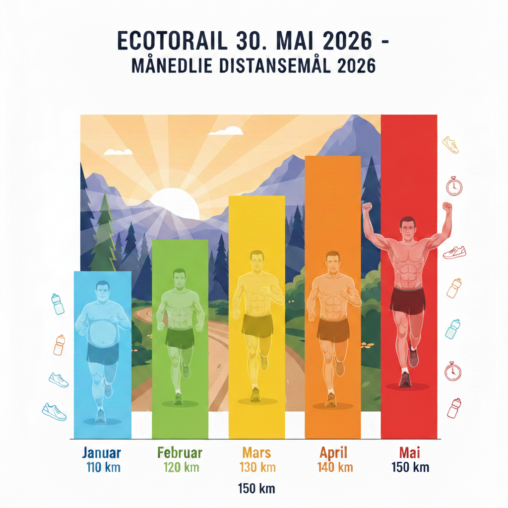
Diagrammet representerer månedlige distansemål i forkant av deltagelse på Ecotrail 30. mai 2026 der en jevn økning i mengde skal sikre suksess under løpet. Hver søyle representerer hver…
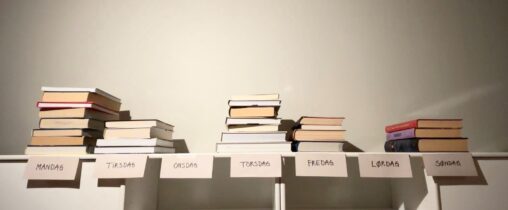
Bildet visualiserer antall studietimer brukt per dag i løpet av uke 7, 2026. En bok representerer 15 min. studietid, dvs. at stabelen med 8 bøker på mandag visualiserer…
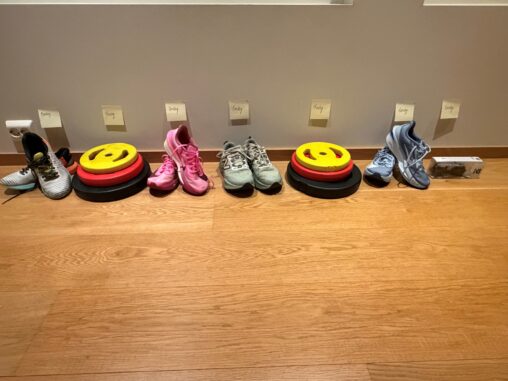
Bildet viser mine treningsaktiviteter som er loggført på Strava i uke 7 Mandag: Løpetur Tirsdag: Styrketrening Onsdag: Løpetur Torsdag: Fjellvandring Fredag: Styrketrening Lørdag: Løpetur Søndag: Svømming
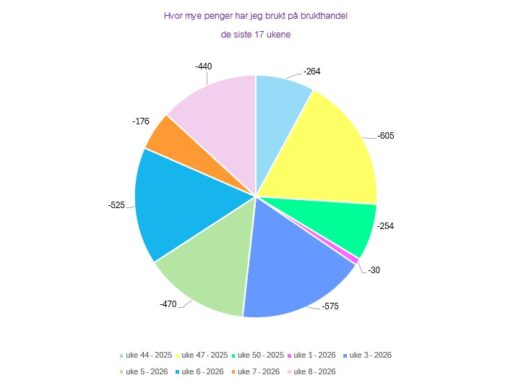
Gjenbruk- og pengebruk-statistikk samlet pr uke. Handel som har blitt gjort både i bruktbutikker og på finn.no. Kun penger ut har blitt med i statistikken.
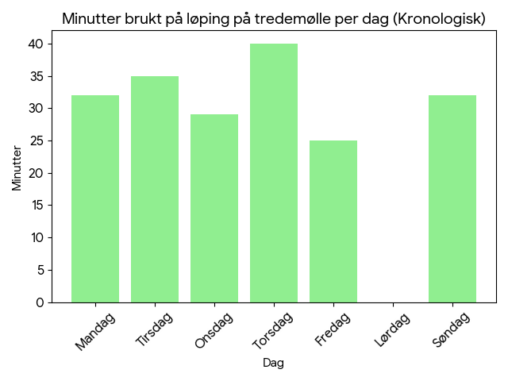
En visualisering av minutter brukt på løping på tredemølle i uke 7. Visualisering laget av Google Gemini basert på rådata fra meg.
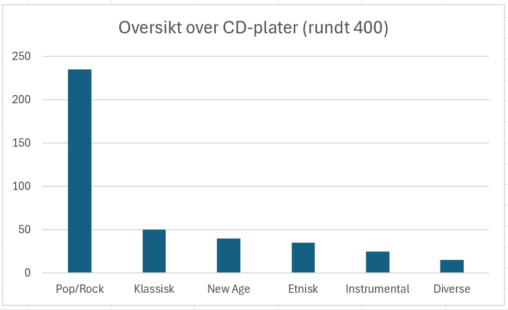
Oversikten viser antall CD-plater per sjanger. Dette er originale CD-plater som var kjøpt i løpet av flere år.

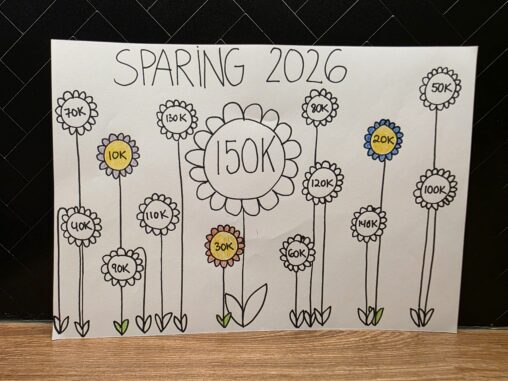
Visualiseringen viser sparemålet mitt for 2026. Hver blomst representerer 10 000 kroner, som fargelegges etter hvert som beløpet på sparekontoen øker. Dataene er hentet fra kontooversikten i egen…
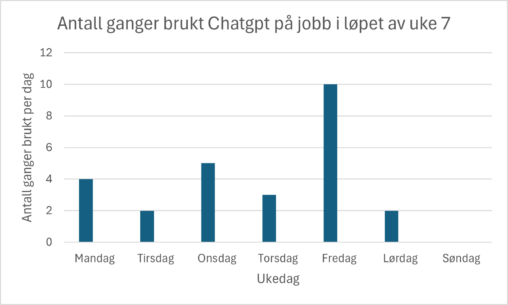
Dataen viser hvor mange ganger jeg har tatt i bruk nettstedet Chatgpt hver arbeidsdag i løpet av en arbeidsuke.
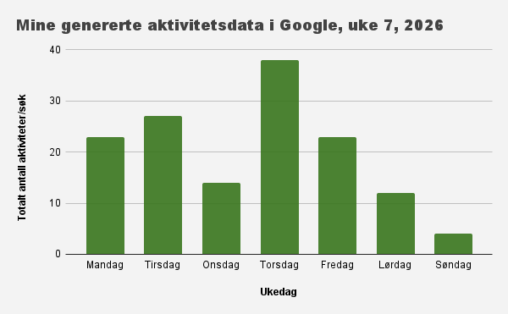
Diagrammet viser aktivitetsdata henta frå myactivity.google.com, der aktivitet er sortert på vekedagar. Aktivitetsdata inkluderar både Google-søk og “andre aktiviteter”, herunder besøk på nettsider eller bruk av appar som…