
(page 158 of 160)
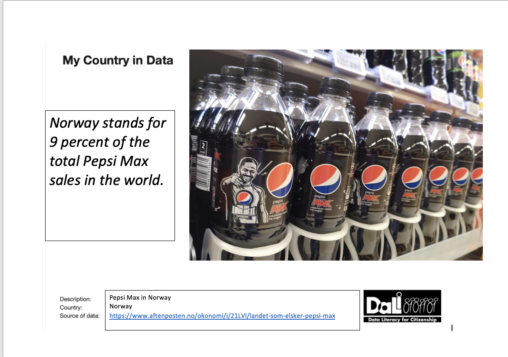
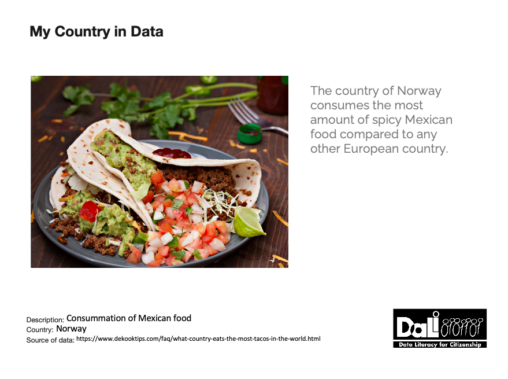
The country of Norway consumes the most amount of spicy Mexican food compared to any other European country.
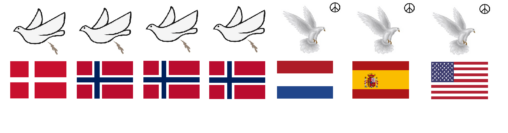
This image details the amount of times I have been pooped on by a bird based on the countries I have visited where birds were present. Denmark: 1…

The trips I have done in my life. I have added all the countries I have visited at least once in my life, and If I have been…
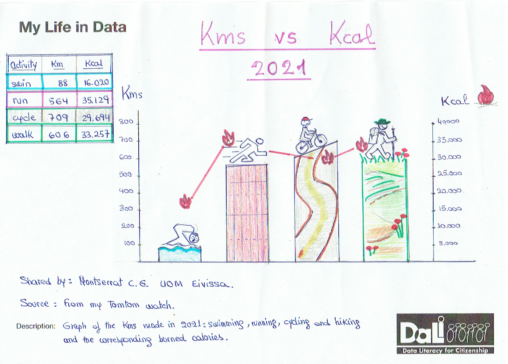
Graph of the kms I did in 2021: swimming, running, cycling and hiking and the corresponding burned calories.
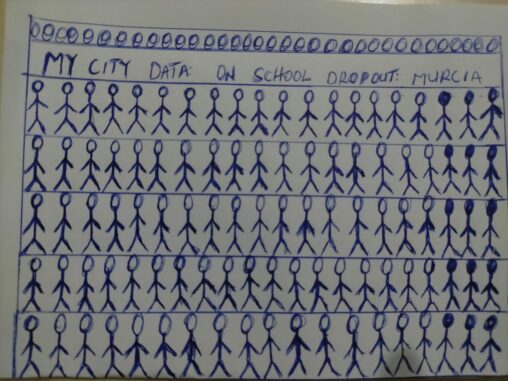
SCHOOL DROPOUT IN THE REGION OF MURCIA IS 16.3%. 2020 STATISTICS. ALSO IS THE SIXTH OUT OF THE TOTAL SEVENTEEN AUTONOMOUS COMMUNITY AND TWO AUTONOMOUS CITY, CEUTA AND…
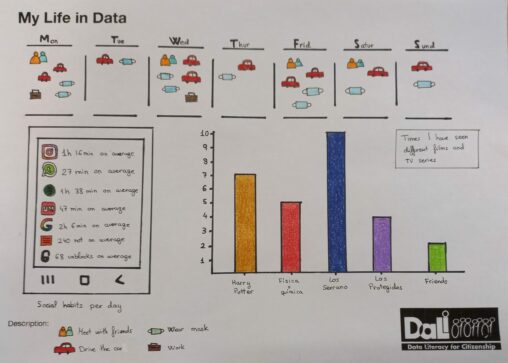
Here is represented my life in data, specifically my social habits per day (time I spend on different apps), what I usually do in the week regarding job,…
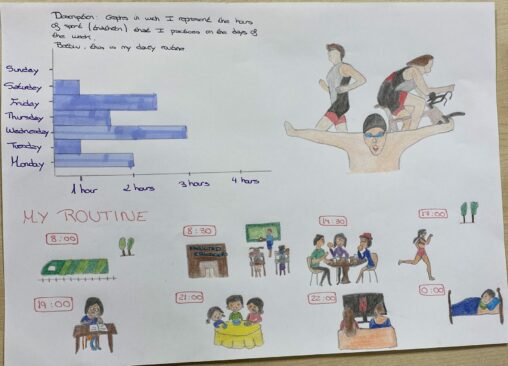
A graphic in wich I represent the hours of sport that I practices on the days of the week. Below, I represent my daily routine
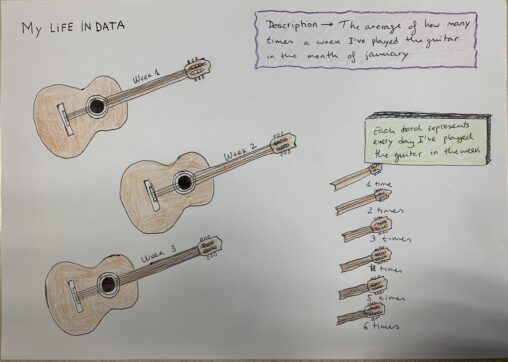
This picture represents the average of how many times a week I have played the guitar in the month of january. Each chord represents every day I have…
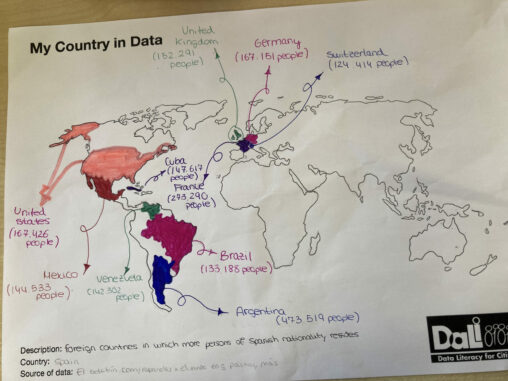
Is a world map that indicates the different countries and the number of Spanish inhabitants who reside there

Here, it is represented a graph between people from 16 to 74 years old that shows in a visual way the percentage of people that have used the…

My mood during the week, the glasses of water that I drink every day and the hours of sleep every day for a week.
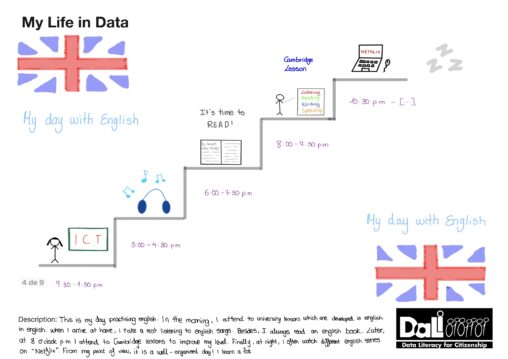
This is my day practising english. In the morning, I attend to my university lessons which are developed in english. When I arrived at home, I take a…
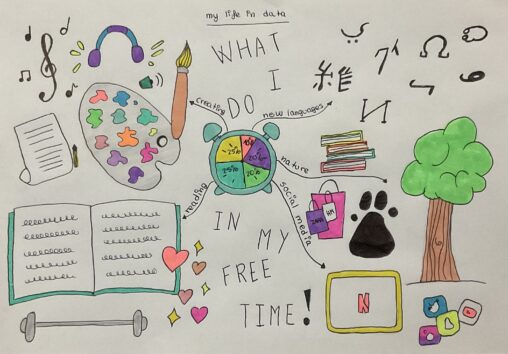
On this picture are represented the percentages of things that I do in my time off.
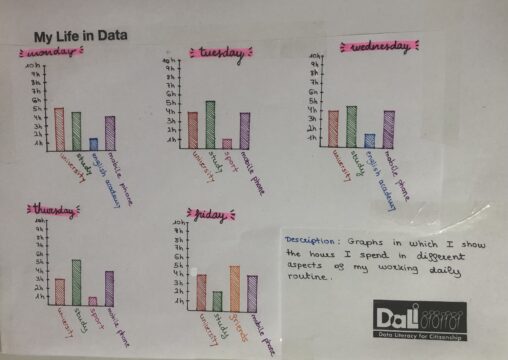
Graphs in which I show the hours I spend in different aspects of my working daily routine.
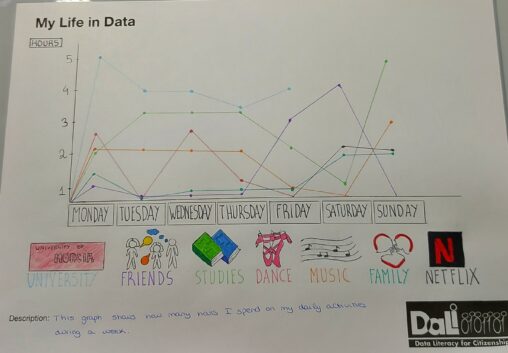
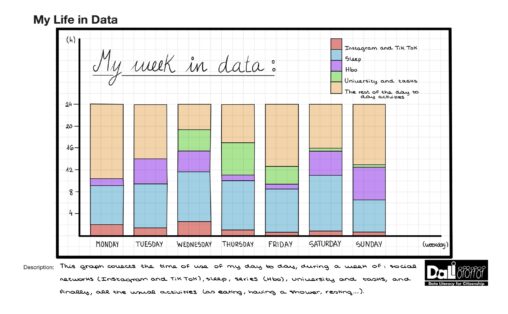
This is a graph representing the daily hours I spend on my daily activities over the course of a week, such as time spent studying or listening to…

This graphic shows how I spend my free time. There are five categories: Family and friends (35%), Computer/Phone (25%), Music and movies (20%), Sport (15%) and Other things…
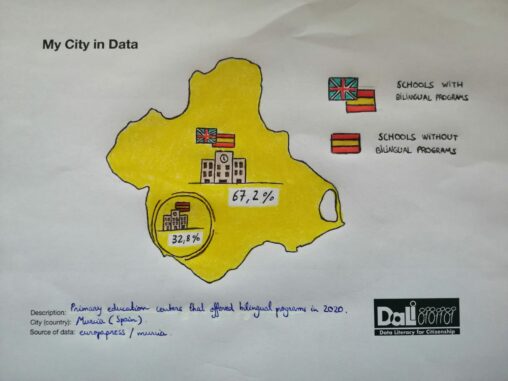
This data visualization represents the percentage of schools which had bilingual programs in the Region of Murcia in 2020.
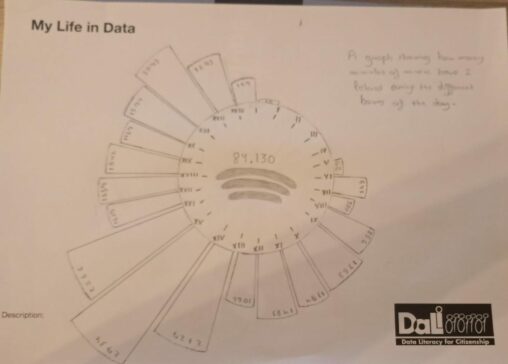
A graph showing how many minutes of music have I listened during the different hours of the day