(page 153 of 155)
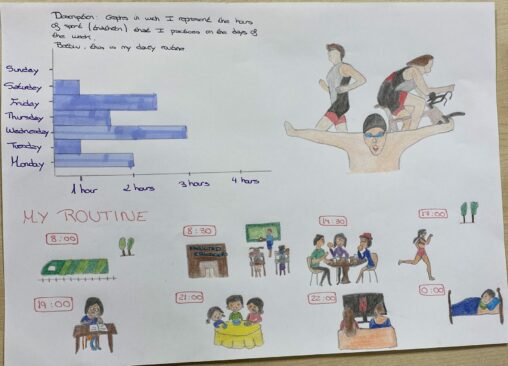
A graphic in wich I represent the hours of sport that I practices on the days of the week. Below, I represent my daily routine
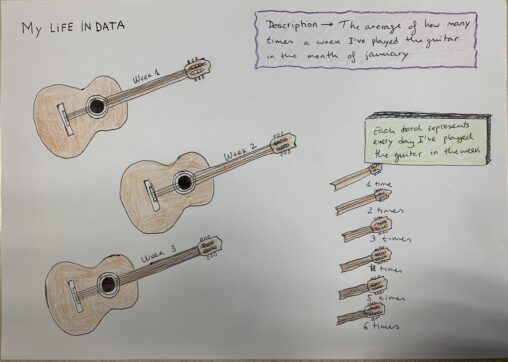
This picture represents the average of how many times a week I have played the guitar in the month of january. Each chord represents every day I have…
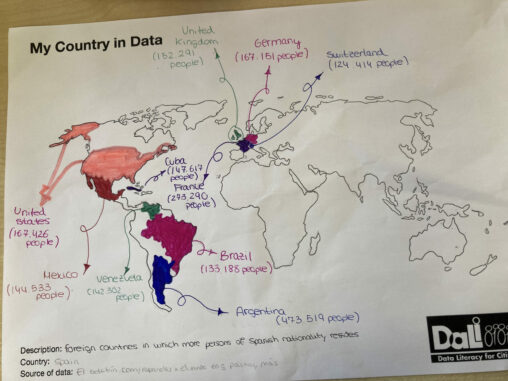
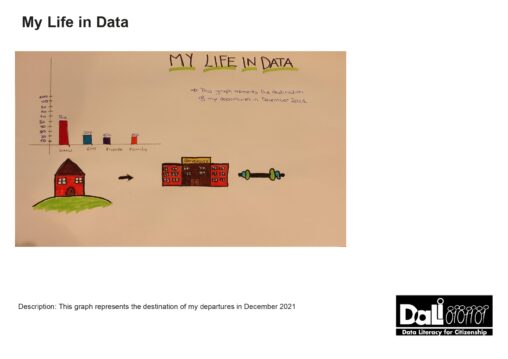
Is a world map that indicates the different countries and the number of Spanish inhabitants who reside there

Here, it is represented a graph between people from 16 to 74 years old that shows in a visual way the percentage of people that have used the…

My mood during the week, the glasses of water that I drink every day and the hours of sleep every day for a week.
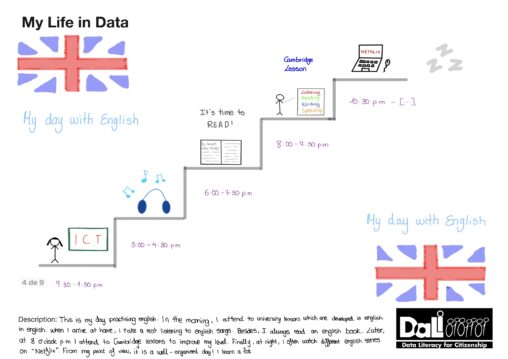
This is my day practising english. In the morning, I attend to my university lessons which are developed in english. When I arrived at home, I take a…
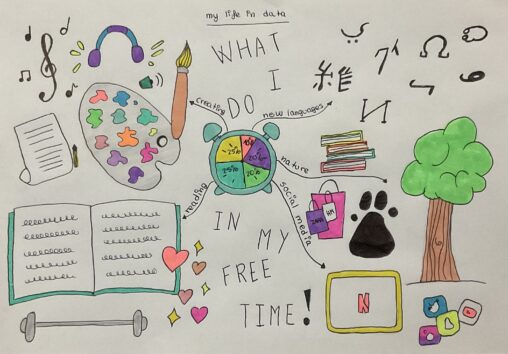
On this picture are represented the percentages of things that I do in my time off.
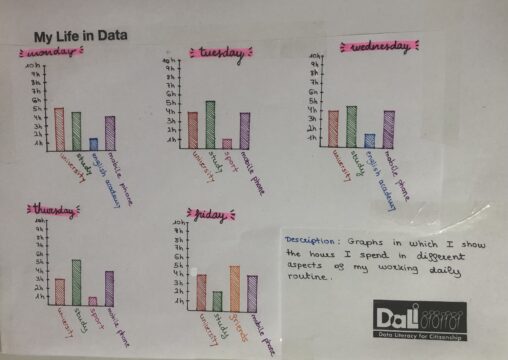
Graphs in which I show the hours I spend in different aspects of my working daily routine.
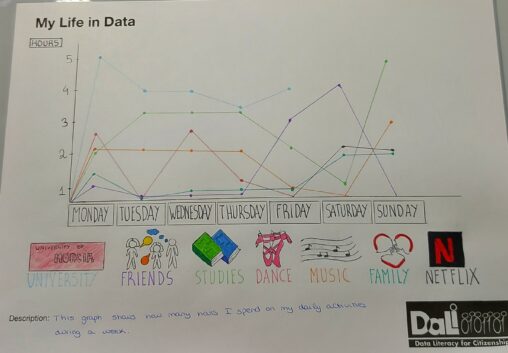
This is a graph representing the daily hours I spend on my daily activities over the course of a week, such as time spent studying or listening to…

This graphic shows how I spend my free time. There are five categories: Family and friends (35%), Computer/Phone (25%), Music and movies (20%), Sport (15%) and Other things…
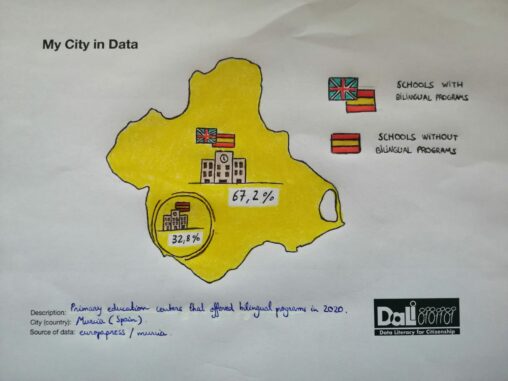
This data visualization represents the percentage of schools which had bilingual programs in the Region of Murcia in 2020.
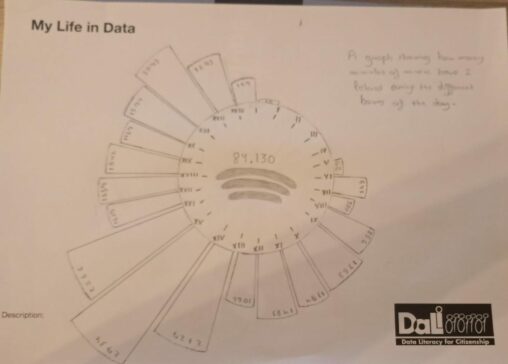
A graph showing how many minutes of music have I listened during the different hours of the day

Here different interesting data about Spain are represented, such as its area, population, spending on education… taken from different sources such as the National Institute of Statistics or…
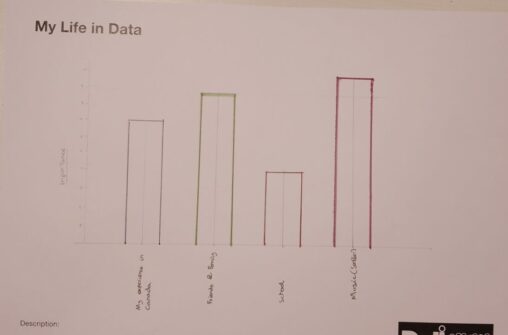
A graph that shows different moments and things that I hold dear or that affect me in some way, I then place a value from 1-10 (1 least…

This draw shows the times I’ve said “hello”, represented by each petal of the flowers, each flower is one day of the week. The colored petals, when I’ve…

In this graph I show the hours I dedicate to one of the things I love to do most in the world, teaching.
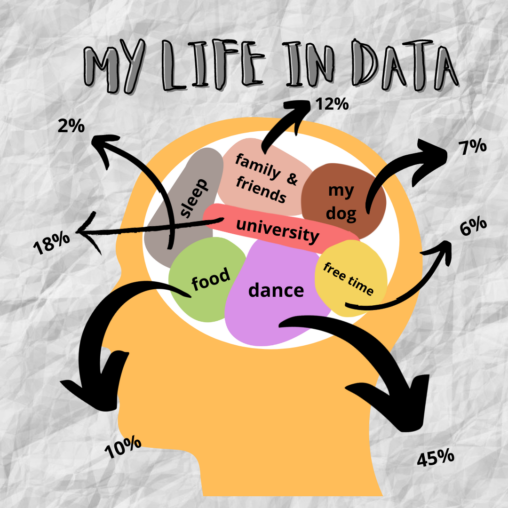
Each things has it´s own percentage but i have to admit that it was very difficult to be precise with this kind of things.
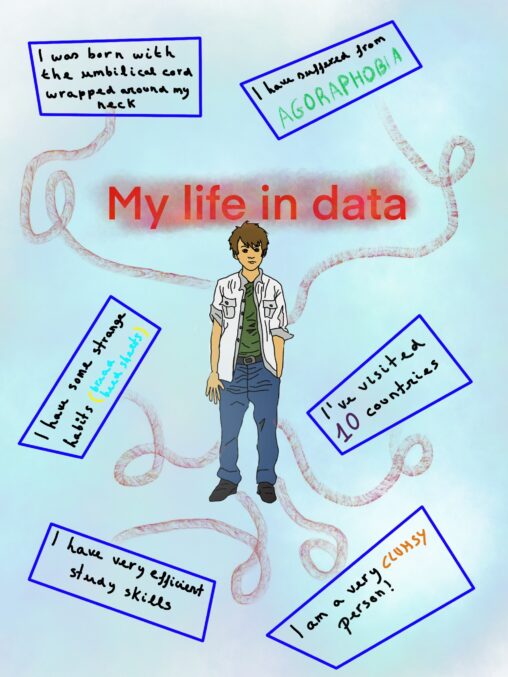
I have shared some interesting data about my life in order to let people learn something about me and my life.

– My favourite activities throughout the week. – My most played songs at the moment. – My top 6 albums more listened.