
(page 151 of 160)
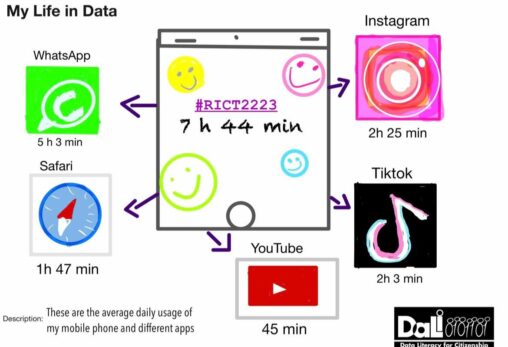
It is clear that nowadays many people spend too much time in front of a screen. But what is the average time spent on mobile phones in Spain?…
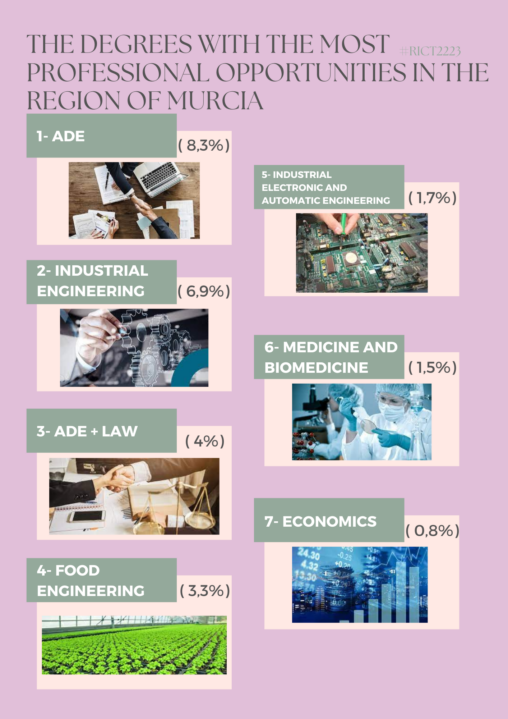
In this infographic we can see which are the degrees with most job opportunities nowadays in the Region of Murcia, based on percentages found in a digital newspaper….
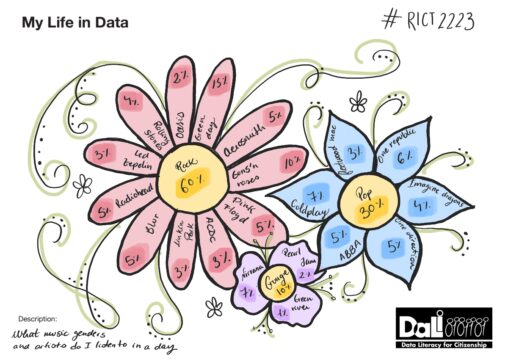
It shows the different music genders and artists that I listen to along my day. I also listen to other genders and artists some days but those are…
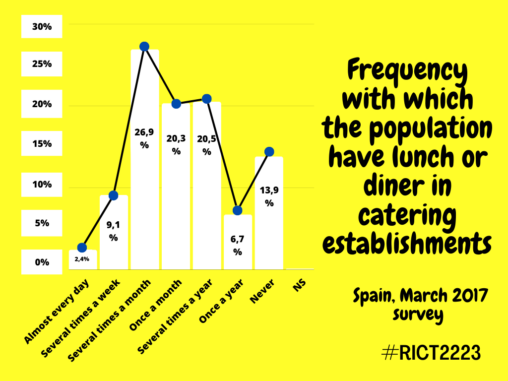
This statistic presents the frequency with which the Spanish population goes to catering establishments, such as restaurants or cafes, for lunch or dinner, according to a March 2017…
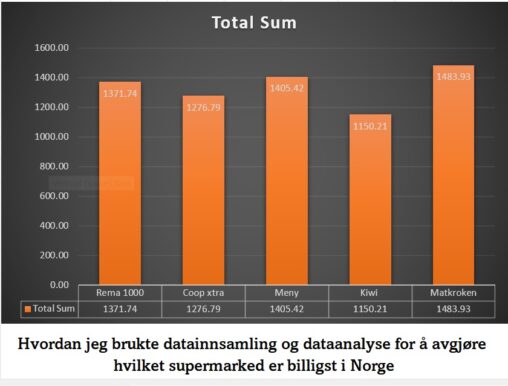
A weekly shopping list and the prices in some supermarkets. Use of data collection and analysis gave me the correct answer to the question ” Which supermarket is…
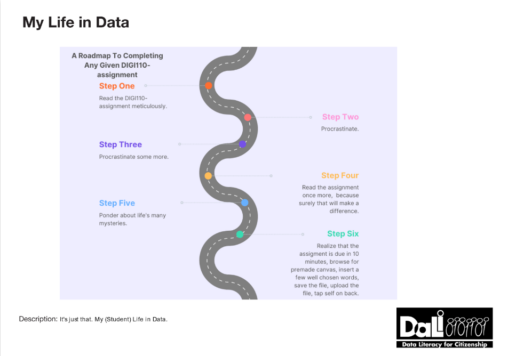
A representation of my process working with this current assignment (to create and upload a file to Dali).

My screentime for week 36. In total 39 hours, 5h and 39m in average. Screenshot from iPhone, no copyright. Self-owned.
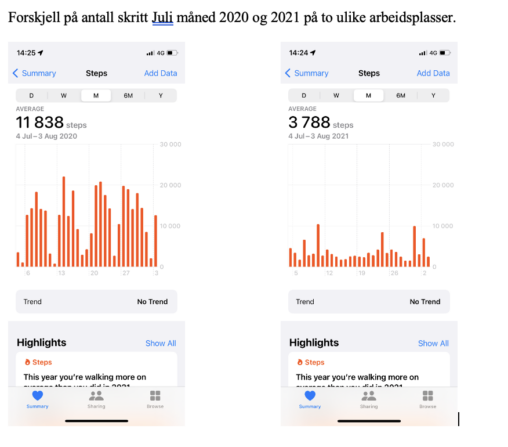
Statistikk hentet fra Helse-appen på Iphone. Viser antall skritt jeg gikk på to ulike arbeidsplasser i 2020 og 2021.
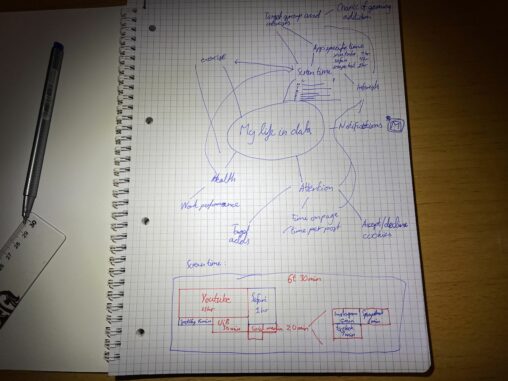
Written in English because of the language of the website. Realistically in Public Domain, since I uploaded it to this website. url=”http://www.themostamazingwebsiteontheinternet.com/”Min_digitale_hverdag_fra_min_telefon”
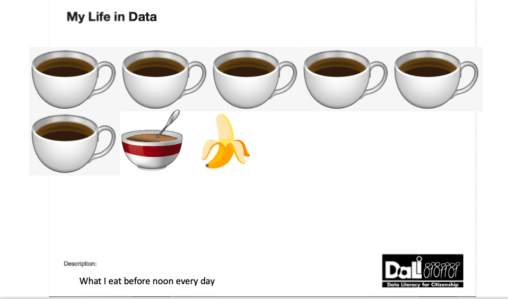
This is what I eat before noon every day. I have counted every cup of coffee over the last few days, and this is what I came up…
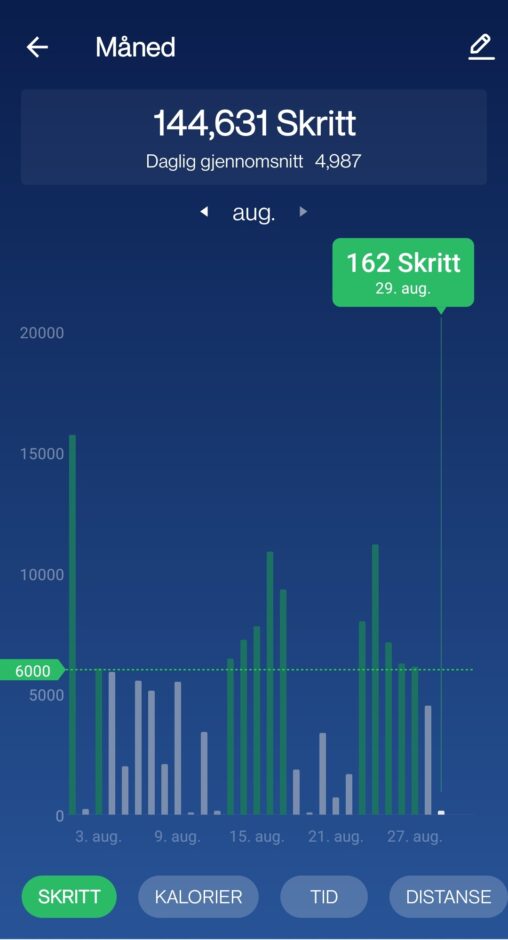
steps taken in an august month, baseline 6000 steps, average steps taken in a month
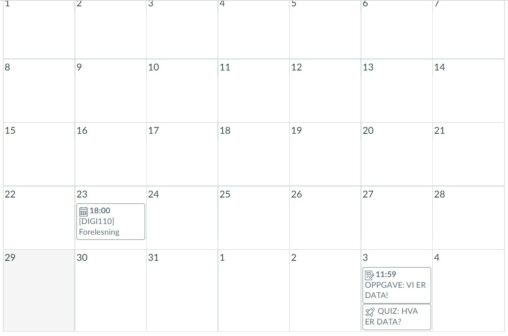
Things just happen in the digital world (that’s my theory, and I’m sticking to it).
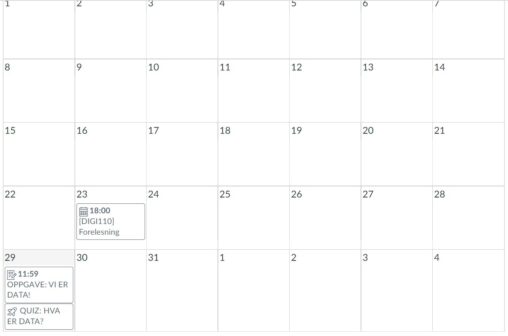
Things just happen in the digital world (that’s my theory and I’m sticking to it).
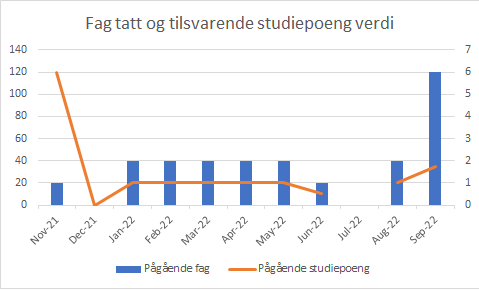
Fag tatt og tilsvarende studiepoeng verdier for individuelle måneder

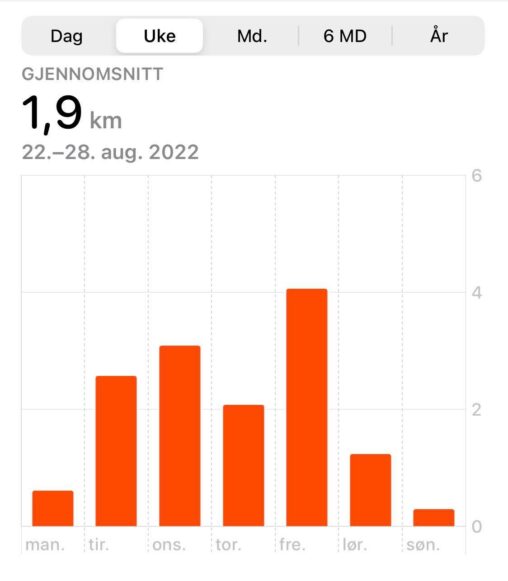
Elias sine treningstimer i uke 35 i årene hhv. 2022 og 2021