
(page 118 of 155)
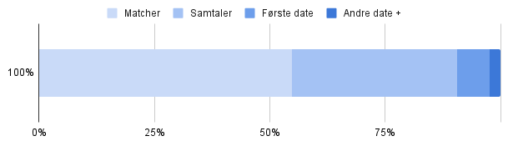
This displays all my Tinder matches from one semester and how many of them lead to next steps.
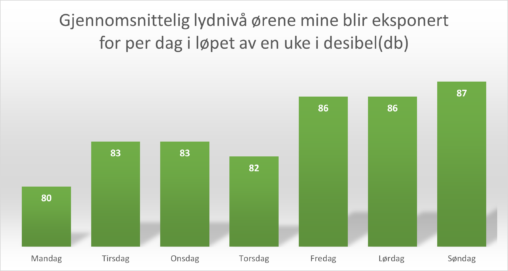
Søylediagrammet viser den gjennomsnittelige lydeksponeringen min per dag over en 7 dagers periode. lyden er målt i desibel(db). lyden kom fra og ble målt gjennom mitt headsett. Søylediagrammet…
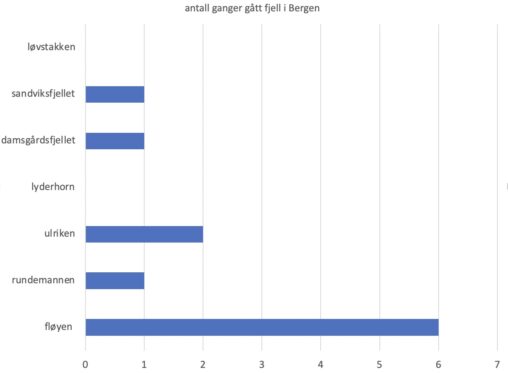
Datavisualisering av antallet ganger jeg har gått de ulike fjellene i Bergen

Datavisualisering av byene jeg har bodd i etter periode, som er Oslo, Bergen, Hjørring (Danmark) og Mannheim (Tyskland).
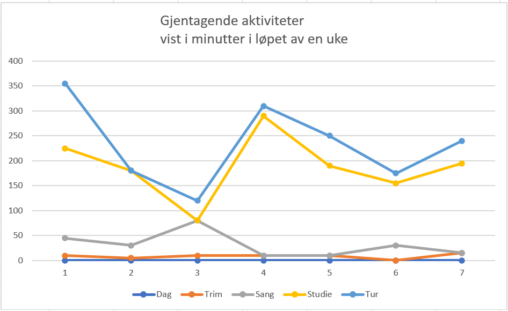
Faste aktiviteter fremstilt i minutter per dag i løpet av en uke. Daglige loggførte aktiviteter. Egne data.

Snøfall dager i løpet av 2023 i Oslo, NO og Bergen, NO.
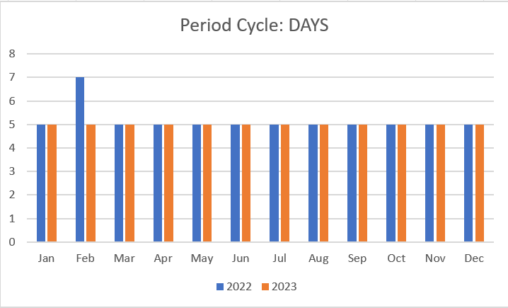
This data shows my life through my menstrual cycle each month, as shown in the chart: my period usually last five days.
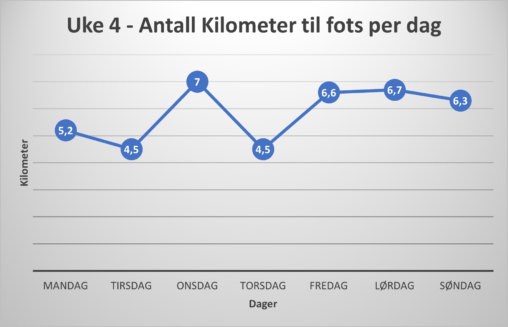
I denne grafen ser vi antall kilometer jeg har gått hver dag i Uke 4, altså 22-28 Januar. På horisontal aksen ser dagene i uken, mens på vertikal…
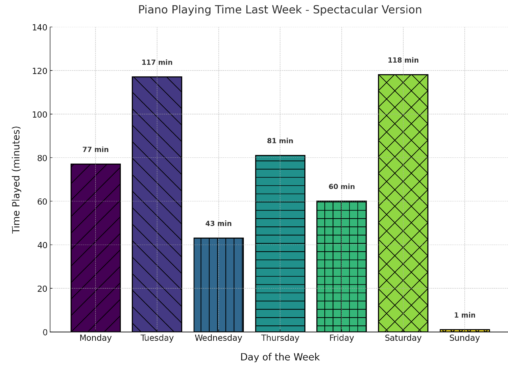
The piano playing time chart for last week. This version includes colorful bars with different patterns for each day, along with annotations displaying the exact time played in…
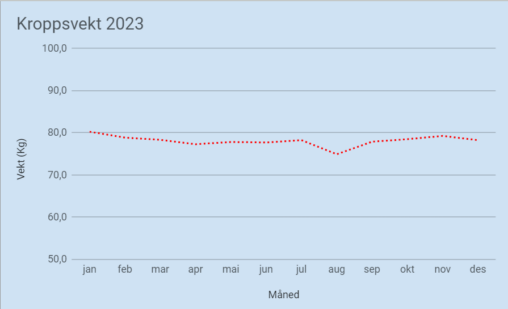
Grafen representerer den gjennomsnittlige kroppsvekten min, målt gjennom 2023. X-aksen representerer måneder og y-aksen representerer den gjennomsnittlige kroppsvekten for måneden, målt i Kg.

Datavisualiseringen viser produksjon av straum få vårt solcelleanlegg år 2023. Det viser også korleis produksjonen varierar frå månad til månad og er størst om sommaren og minst om…
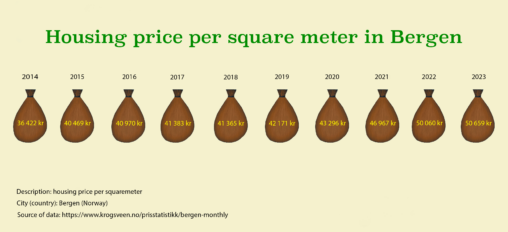
What is being shown is the housing price in Bergen per square meter from December of 2014 to December of 2023, using statistics from

Datavisualiseringen viser produksjon av straum frå solcelleanlegget som er på taket til bustaden. Søylediagrammet for 2023 viser korleis produksjonen varierar frå månad til månad og med årstidene der…
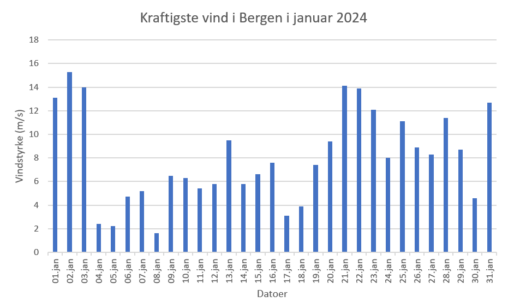
Oversikt over den kraftigste vinden i Bergen hver dag i januar 2024. Vindstyrken er oppgitt i m/s. (Laget i Excel med data fra yr.no, en tjeneste fra NRK…

Y-aksen representerer antall kilometer, og X-aksen representerer dagene i januar
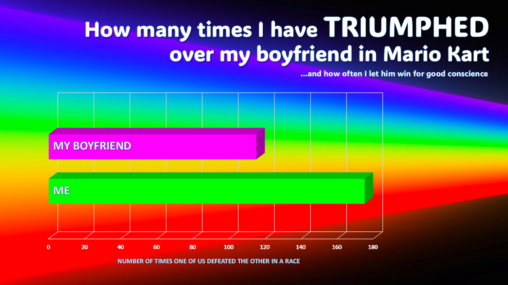
The amount of times my boyfriend and I have raced against each other in Mario Kart and one of us placed higher than the other. Numbers per race…
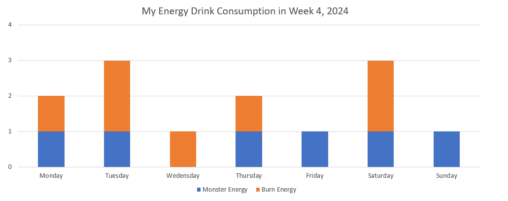
Graph represents amount of energy drinks consumed every day in week 4 of 2024. X-axis shows day of the week. Y-axis shows amount of energy drinks consumed. All…