
(page 117 of 155)
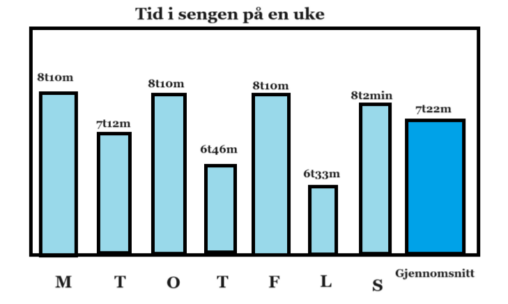
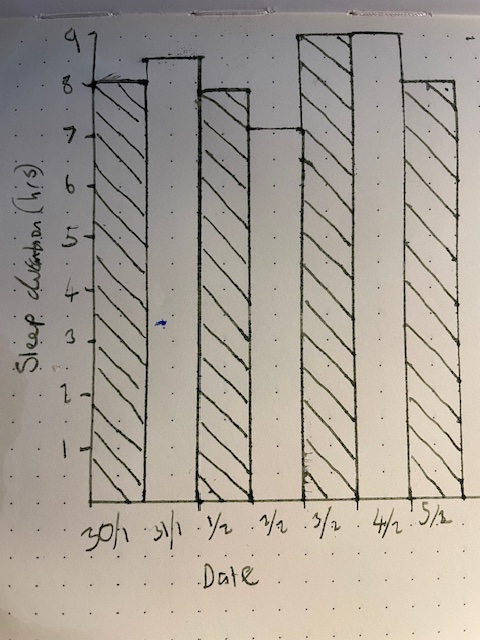
Diagrammet viser antall timer brukt i sengen daglig fra mandag 29. januar til søndag 4. februar.
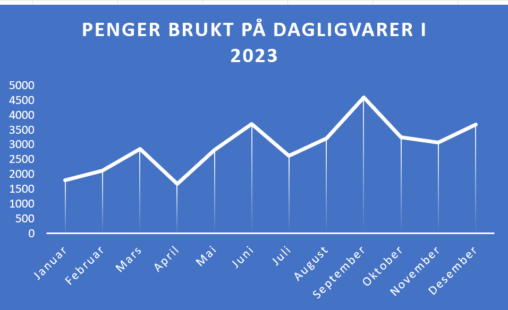
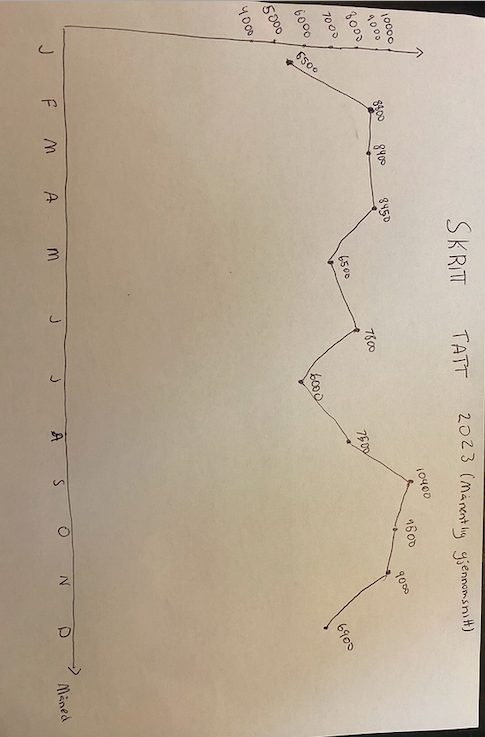
Data fra banken min om hvor mye penger som går til dagligvarer hver måned fra januar 2023 til desember 2023
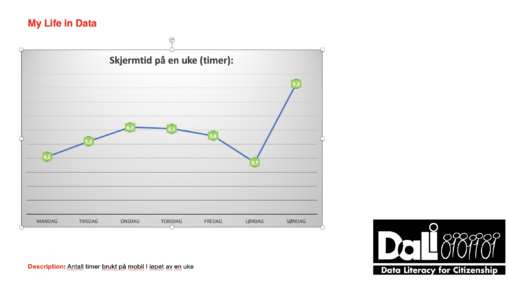
Bildet viser hvor mange timer jeg har vært aktiv på min iphone. Dataene er presentert i timer, hvor du ser et høyest antall på søndagen.
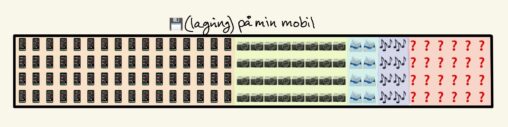
Fremstilling av hva som tar opp lagringsplass på mobilen min.

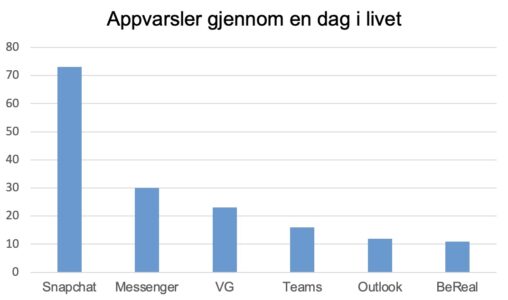
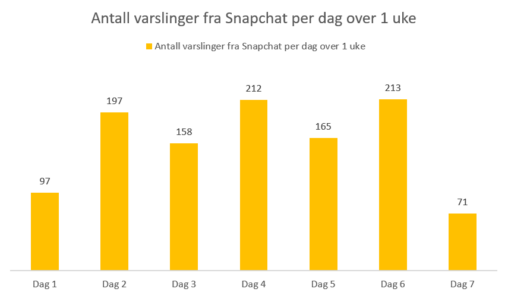
Denne visualiseringen viser digital interaksjon gjennom varsler på min iPhone, gjennom én dag. Diagrammet viser ulike apper som sender meg varsler i løpet av dagen, og gir innsikt…
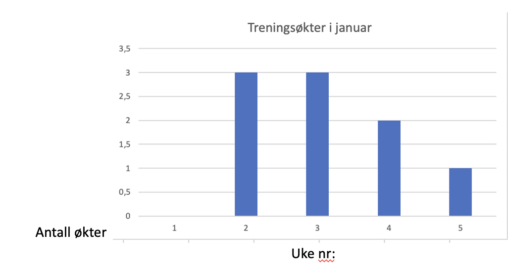
Hvor mange treningsøkter jeg har hatt i januar. Jeg har funnet statistikken fra Sats sin app.
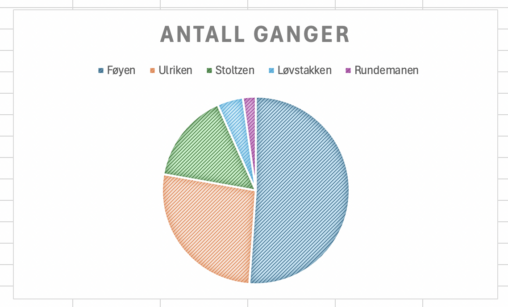
Dette diagrammet viser en oversikt over hvor mange ganger jeg har gått opp noen av Bergens mest kjente fjell.
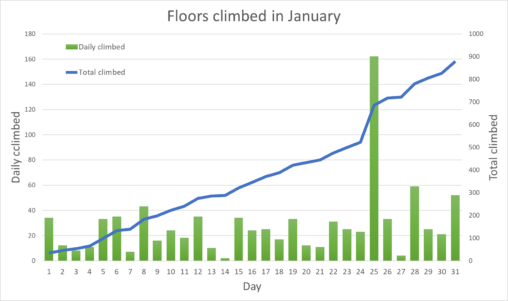
Number of floors climbed each day in January (green) and total number of floors climbed in January by X day (blue).
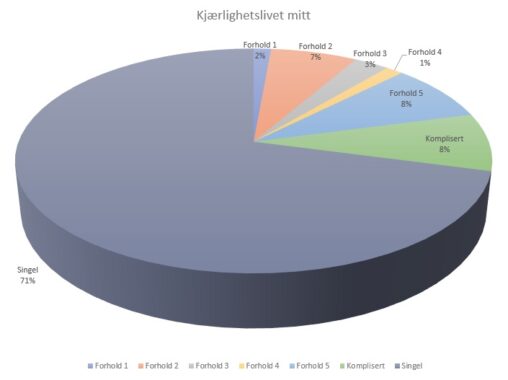
Kjærlighetslivet mitt visualisert, hvor mye av livet mitt har jeg vært i forhold, singel eller ting har vært komplisert.

This graph shows the amount of coffee units collected by me during a month (January 5th to February 4th). I had a coffee subscription at the time and…
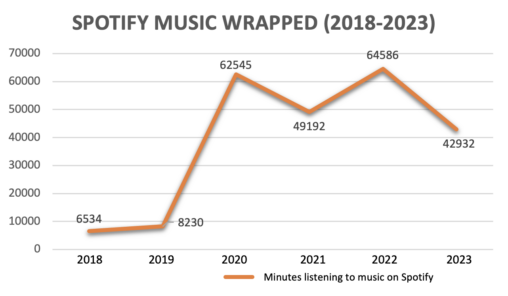
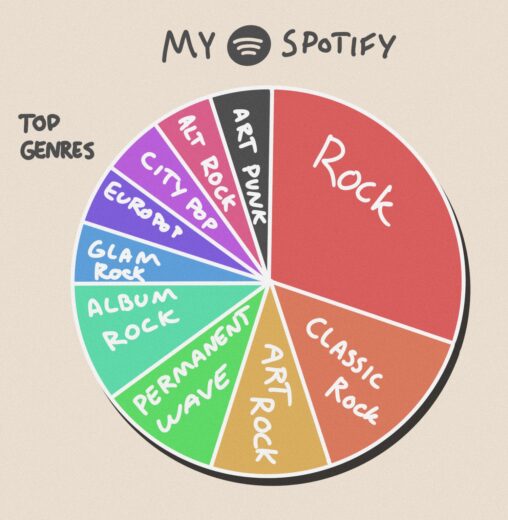
Individuell/personlig statistikk av musikk lytte minutter på musikk-plattformen Spotify. Tjenesten danner statistikk ut i fra min lytte-aktivitet for hvert år jeg er kunde hos dem. Dermed har jeg…
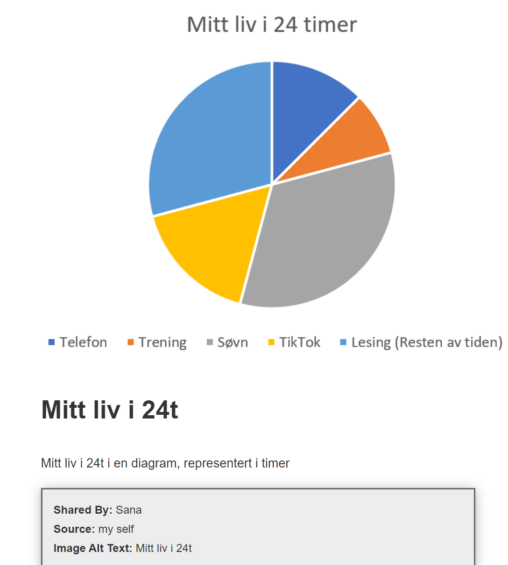
Jeg brukte data fra “Skjermtid” som jeg fant under innstillinger på min iPhone. Her kan man se hvor mye skjermtid man bruker iløpet av en dag og en…