
(page 106 of 155)
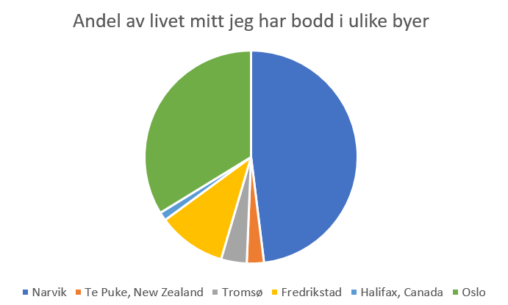
self-reporting on which cities I have lived in and for how many years I have lived in those citiest, the data are my own.
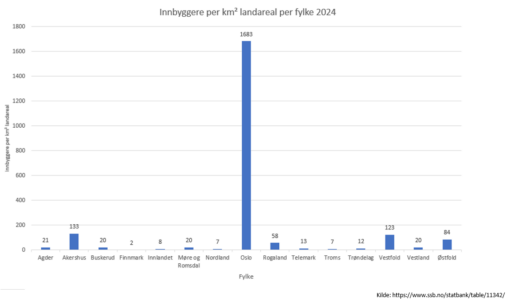
Tabellen viser hvor mange innbyggere som bor per km² landareal fordelt per fylke i Norge i 2024. Tallene er hentet fra ssb.no.

. A simple visualization of the last ten years of my music listening history. Made with and Adobe Photoshop.

Bibliotekets app BookBites gir oversikt over hvor mange minutter jeg har lest e-bøker og hørt på lydbøker. Skjermbilde av egen lesestatistikk fra tilfeldig valgte uker siste år.
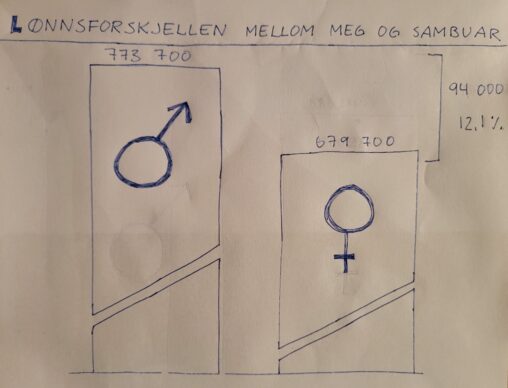
Difference between me and my boyfriends wage level, february 2024. Our own data.
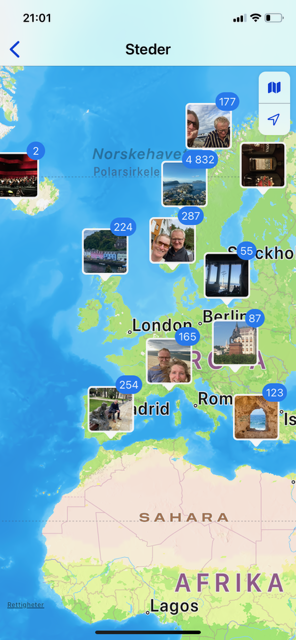
Viser hvor i verden jeg har vært når jeg har tatt bilder med min nåværende Iphone
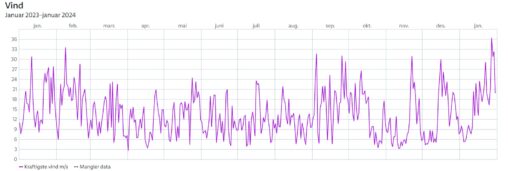
Creative Commons 4.0 https://creativecommons.org/licenses/by/4.0/ Owner of the data: yr.no
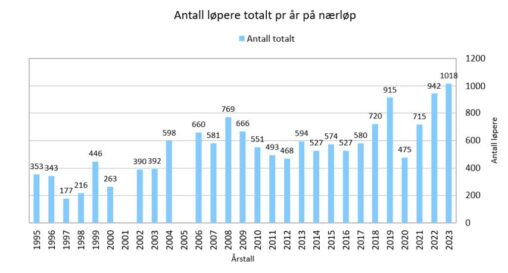
Utviklinga av totalt tal deltakarar på løp som Førde idrettslag Orientering har arrangert i perioden 1995 – 2023. Vi ser utviklinga frå 395 startande i 1995 til 1018…


Oversikt over antall timer, antall km, antall personlige rekorder og antall aktiviteter i 2023

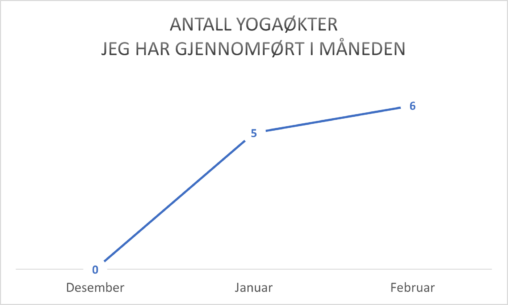
Antall yogaøkter jeg har hatt i måneden i perioden desember-februar.

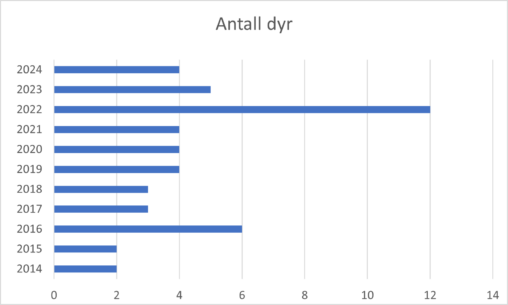
Grafisk fremstilling over antall dyr jeg har hatt 10 siste år fordelt på årstall i perioden 2014 – 2024.

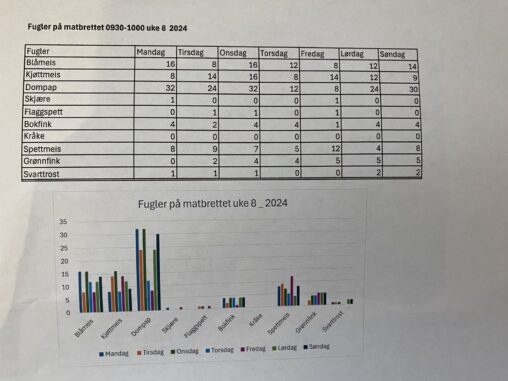
Visuell telling av fuglene som besøkte matbrettet mitt mellom 0930- 1000 uke 8