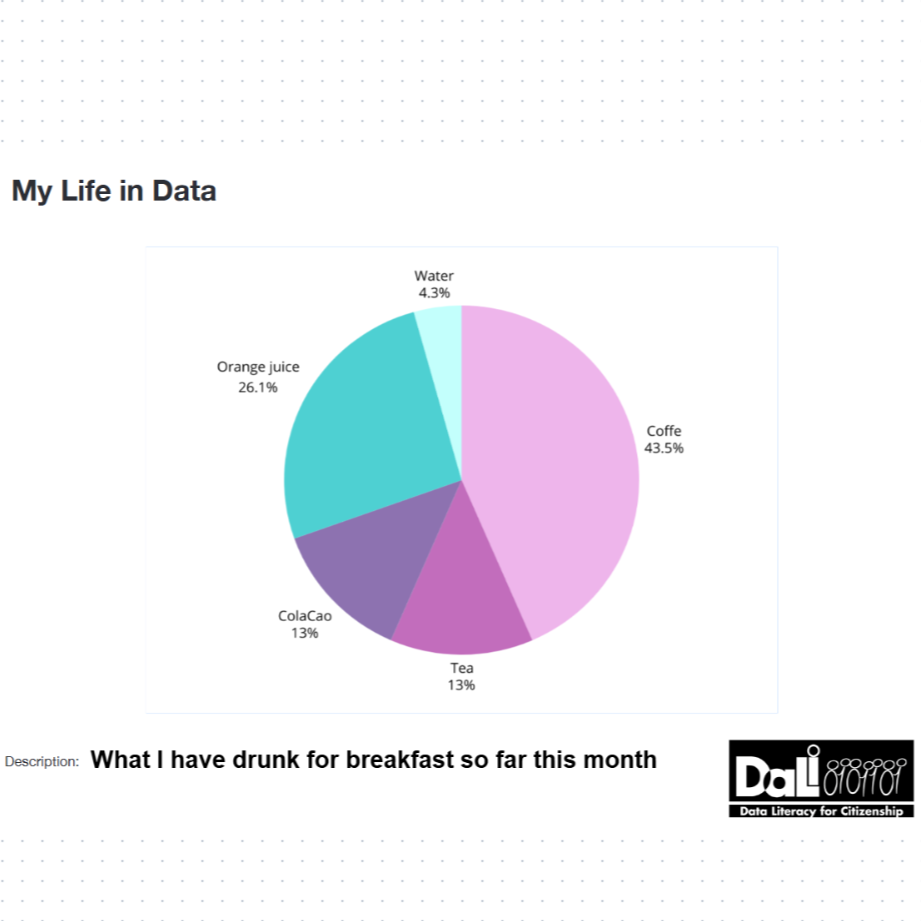
This graphic shows the percentage of how much coffee, tea, ColaCao, orange juice and water I have drunk for breakfast so far this month. This way it visually shows what I drank the most and the least out of these five options. I did the graphic with Canva.