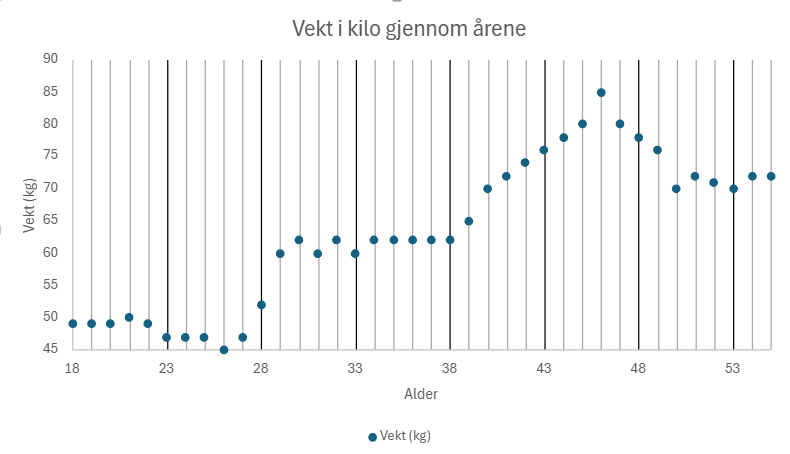
The data was collected by me and pertains to myself; it is my own data. The data shows my own weight on the y-axis (between 45 and 85 kg) and my age on the x-axis (between 18 and 55 years) in a scatter plot graph.

A SPLOT on the Web: DALI worlds.
Blame @cogdog for the TRU Collector Theme, based on Fukasawa by Anders Norén.
The data was collected by me and pertains to myself; it is my own data. The data shows my own weight on the y-axis (between 45 and 85 kg) and my age on the x-axis (between 18 and 55 years) in a scatter plot graph.