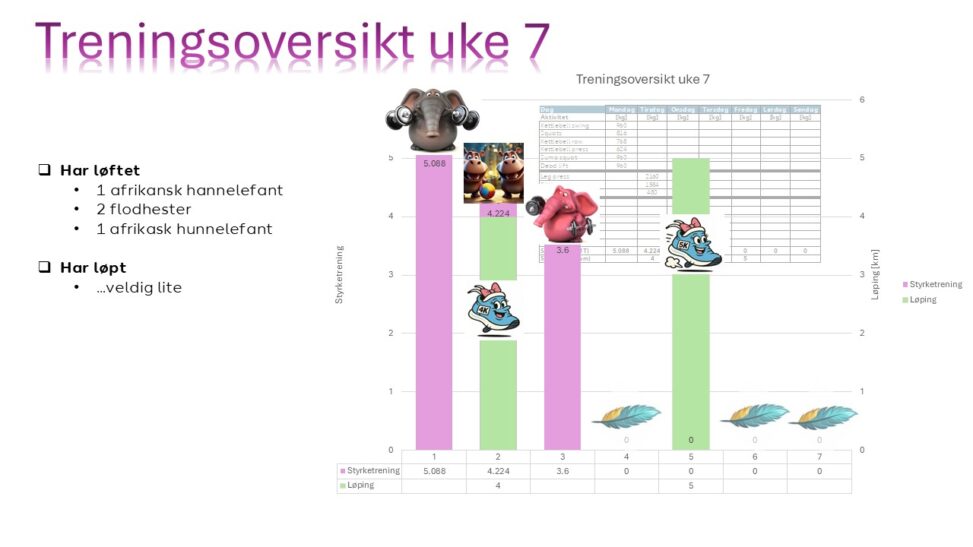
The visualization provides information about how much I have trained during week 7 2026. The total amount of weight lifted is illustrated by something that is recognizable – animals. The summarizing graph as well as the input data with activities are represented in the visualization.