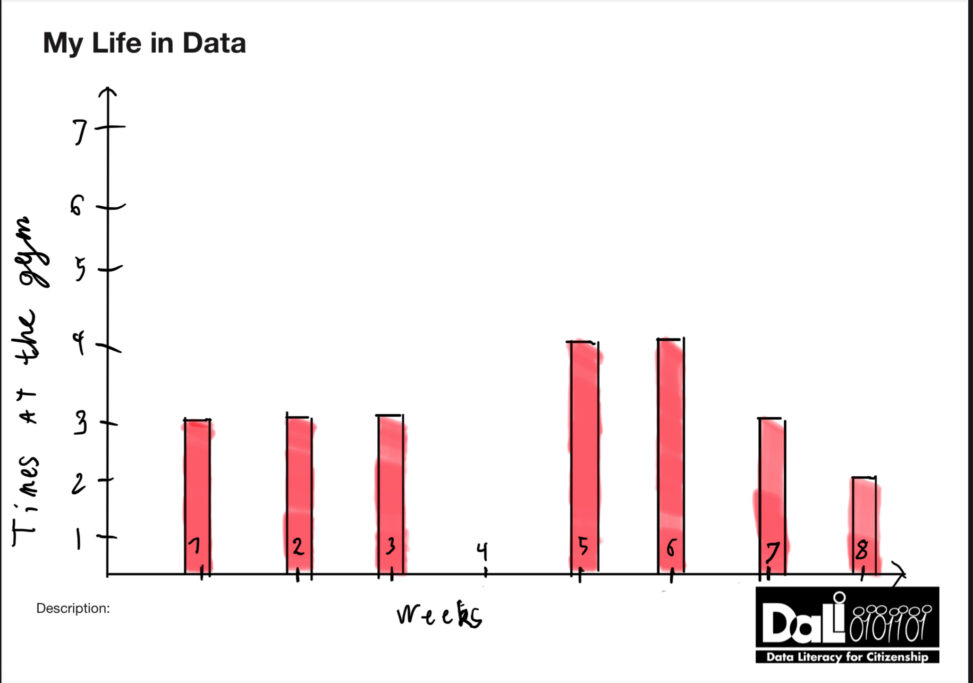
A bar chart visualization of how many times a week if been to the gym for the last two months. The Y-axis represents how many times I’ve been in a week and the X-axis represents which week it is.

A SPLOT on the Web: DALI worlds.
Blame @cogdog for the TRU Collector Theme, based on Fukasawa by Anders Norén.
A bar chart visualization of how many times a week if been to the gym for the last two months. The Y-axis represents how many times I’ve been in a week and the X-axis represents which week it is.