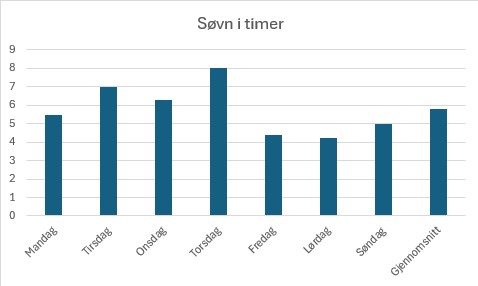
This graph shows how many hours i slept every night, from the 29.01 to the 04.02. The it aslo showed my avrage in the last column. The owner of the data is me, and the graph is made in excel.


This graph shows how many hours i slept every night, from the 29.01 to the 04.02. The it aslo showed my avrage in the last column. The owner of the data is me, and the graph is made in excel.