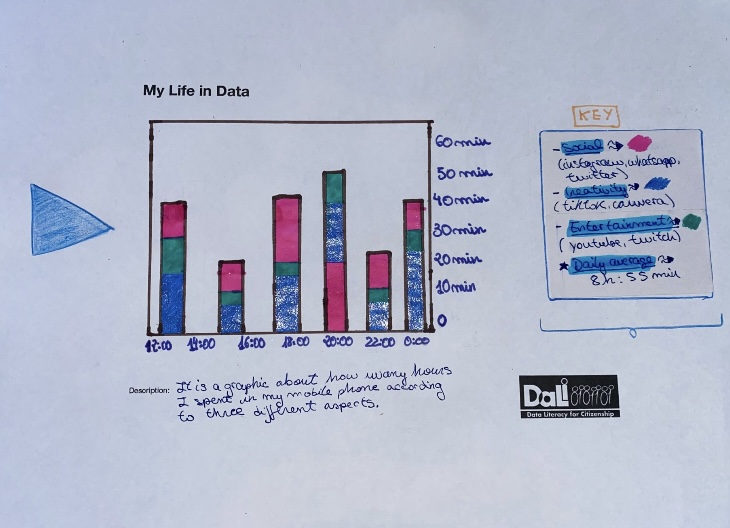
In this data visualization is being represented how much time I spend using my mobile phone according to three different aspects.

A SPLOT on the Web: DALI worlds.
Blame @cogdog for the TRU Collector Theme, based on Fukasawa by Anders Norén.
In this data visualization is being represented how much time I spend using my mobile phone according to three different aspects.