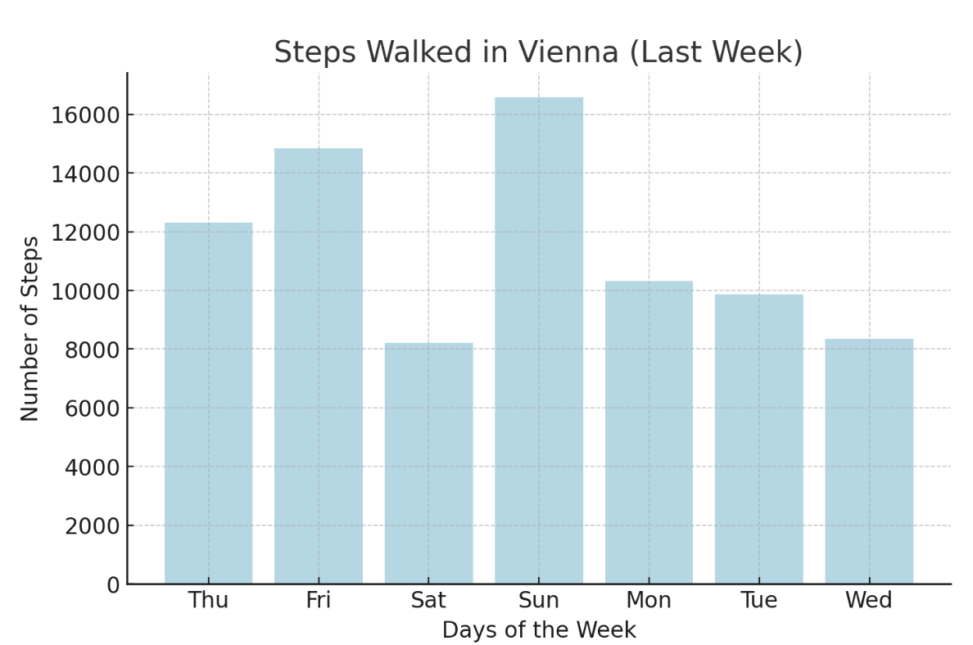
This bar chart represents the number of steps I walked each day during my trip to Vienna from January 23 to January 29, 2025. The x-axis displays the days of the week (Thursday to Wednesday), while the y-axis represents the number of steps taken each day. The data, measured in steps, was collected using a fitness tracker. This visualization highlights variations in my daily physical activity while exploring the city.