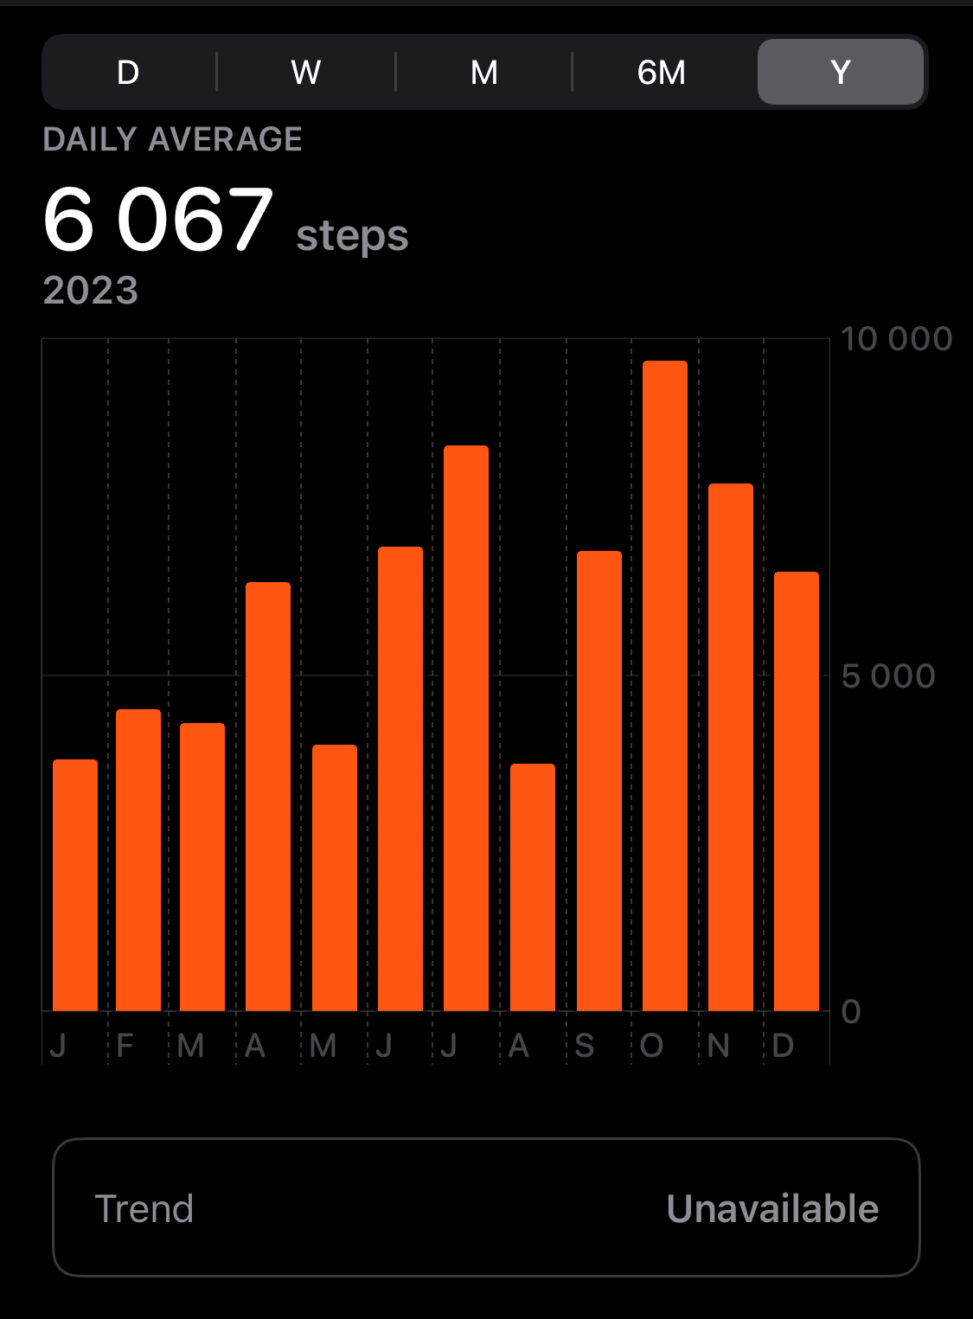
This graph shows my daily average of steps taken each month of the year 2023. The numbers are represented in averages from up to 10 000 each month where October was the highest with 9 667 and august the lowest with 3 685.

A SPLOT on the Web: DALI worlds.
Blame @cogdog for the TRU Collector Theme, based on Fukasawa by Anders Norén.
This graph shows my daily average of steps taken each month of the year 2023. The numbers are represented in averages from up to 10 000 each month where October was the highest with 9 667 and august the lowest with 3 685.