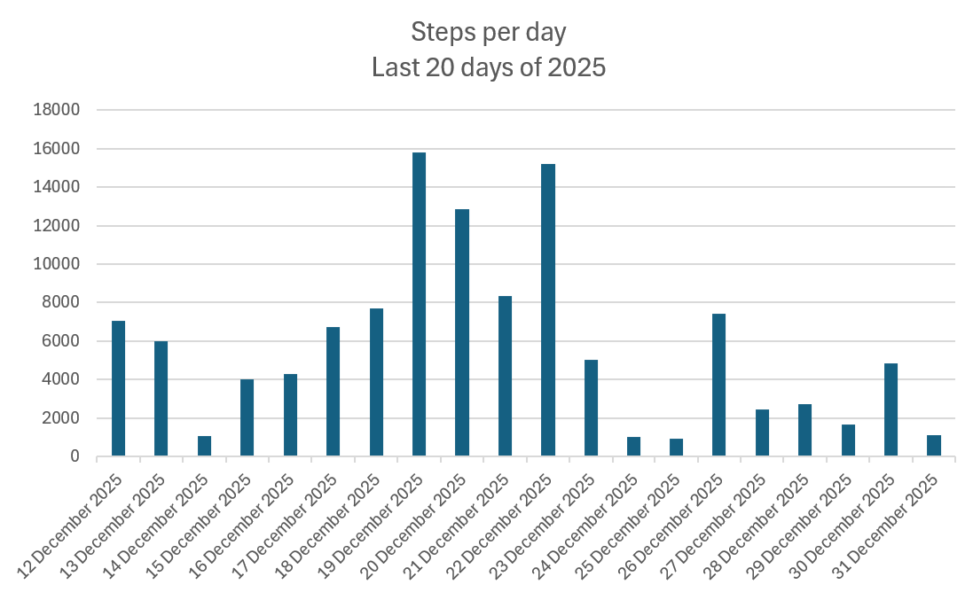
This Graph shows my step count per day during the last 20 days of 2025. The graph illustrates my activity day by day from December 12 to December 31 2025. Data is collected from my personal apple phone IOS system.

A SPLOT on the Web: DALI worlds.
Blame @cogdog for the TRU Collector Theme, based on Fukasawa by Anders Norén.
This Graph shows my step count per day during the last 20 days of 2025. The graph illustrates my activity day by day from December 12 to December 31 2025. Data is collected from my personal apple phone IOS system.