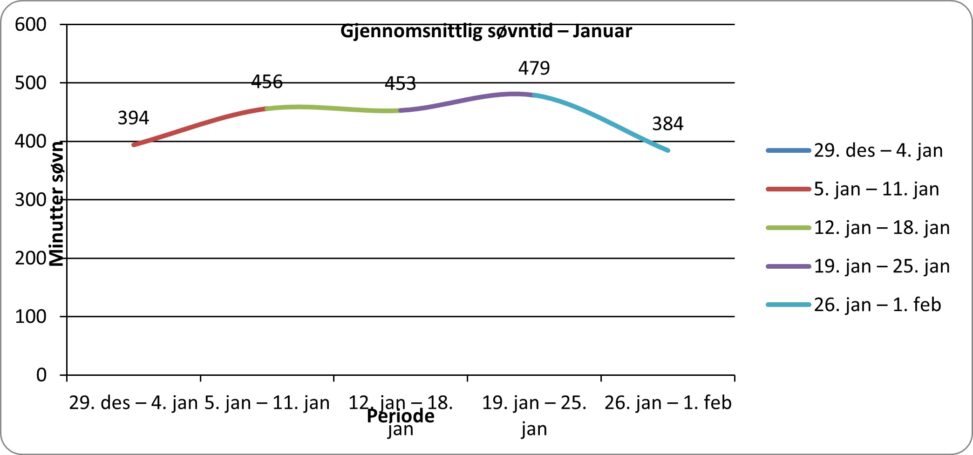
This visualization shows my average sleep duration per week from 29 December to 1 February, measured in hours and minutes. The data is presented as a line chart to illustrate changes in sleep patterns over time. The sleep data was personally collected and recorded by me and represents my everyday life. I am the owner of the data, and it is shared for educational purposes with no copyright restrictions (personal data / public domain).