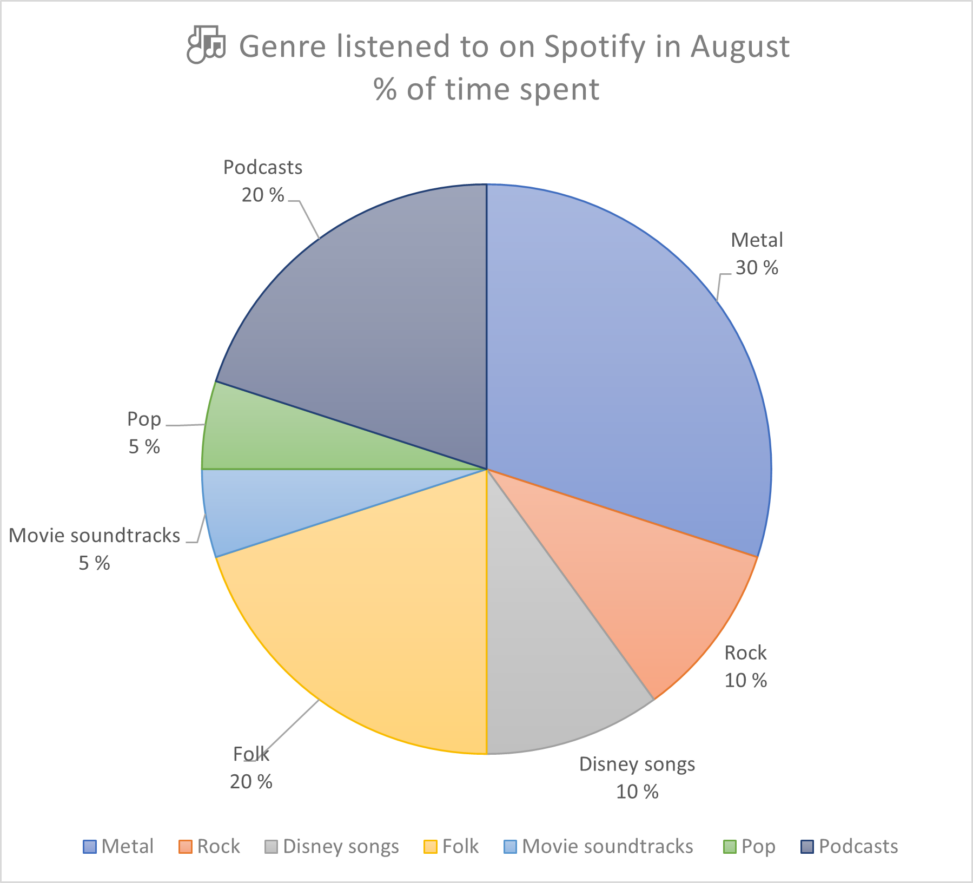
Data from my most recent playlists on Spotify displayed as a pie chart showing % of time spent on each (very individually assigned by me!) genre. CC 4.0

A SPLOT on the Web: DALI worlds.
Blame @cogdog for the TRU Collector Theme, based on Fukasawa by Anders Norén.
Data from my most recent playlists on Spotify displayed as a pie chart showing % of time spent on each (very individually assigned by me!) genre. CC 4.0