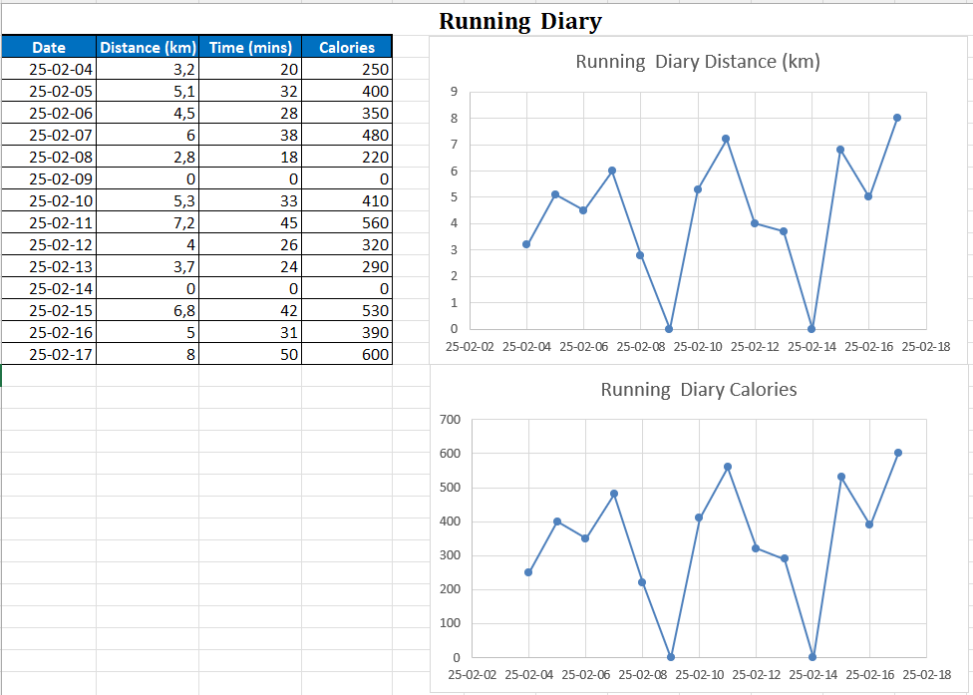
This line graph represents the running distance (in kilometers) over a 14-day period, from February 4, 2025, to February 17, 2025. Each data point marks the distance run on a particular day, with breaks on February 9 and February 14 (rest days). The trend illustrates variations in running habits, including short and long runs.
Data Ownership: This dataset was created based on daily running.
Copyright Status: freely available for use.
Software Used: The graph was generated using Excel.