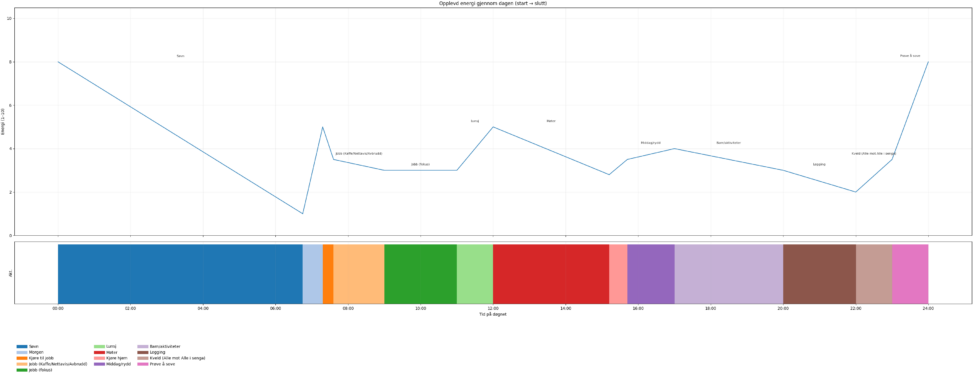
A visualisation of experienced/selfreported energy levels through an average day. Energy levels are self-reported estimates. All estimates reported at time of low energy. Read as fictional.
Visualisation created with Python 3.x, using Matplotlib.

A SPLOT on the Web: DALI worlds.
Blame @cogdog for the TRU Collector Theme, based on Fukasawa by Anders Norén.
A visualisation of experienced/selfreported energy levels through an average day. Energy levels are self-reported estimates. All estimates reported at time of low energy. Read as fictional.
Visualisation created with Python 3.x, using Matplotlib.