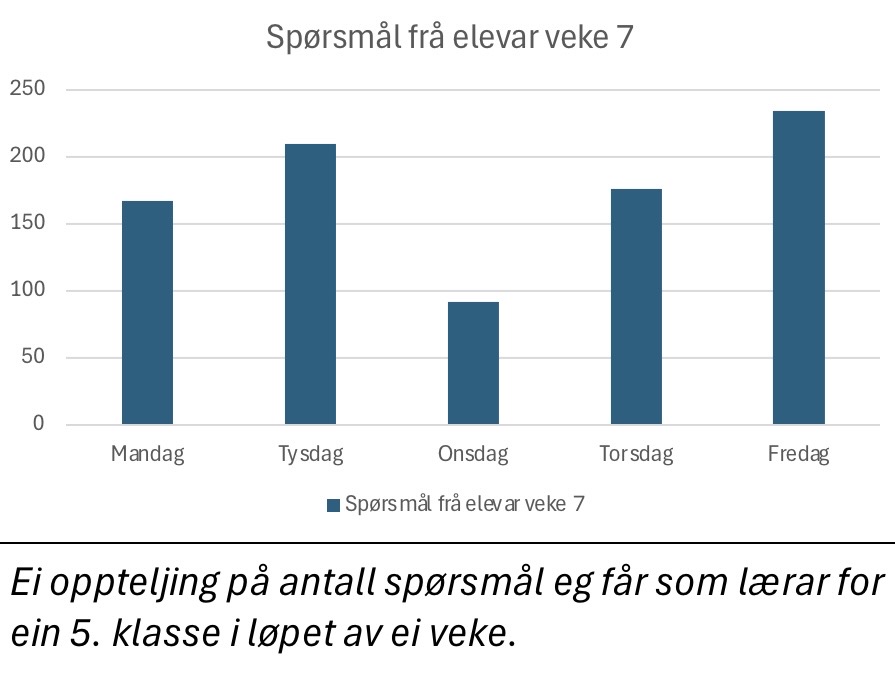
The image represents the types and frequency of questions I receive during a typical school week as a teacher in February 2026. The data visualised are based on personal observations from one working day and include questions from my students. The unit represented is number of questions per category.
The data are self-collected and based on my own professional experience. The visualisation is original work created by me. The copyright is therefore owned by the author.