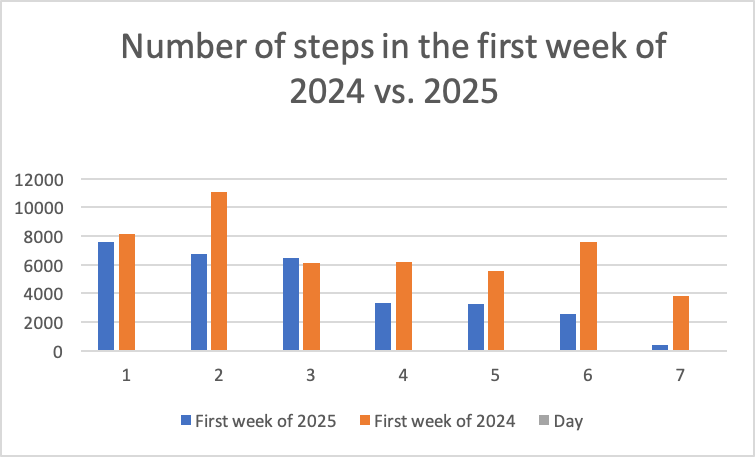
Number of steps walked in the first week in two different years. x- axis shows numbers 1-7 representing days in a week from monday to friday. y-axis is amount of steps walked. Blue data is from 2025, and orange is from 2024. I am the owner of the data.