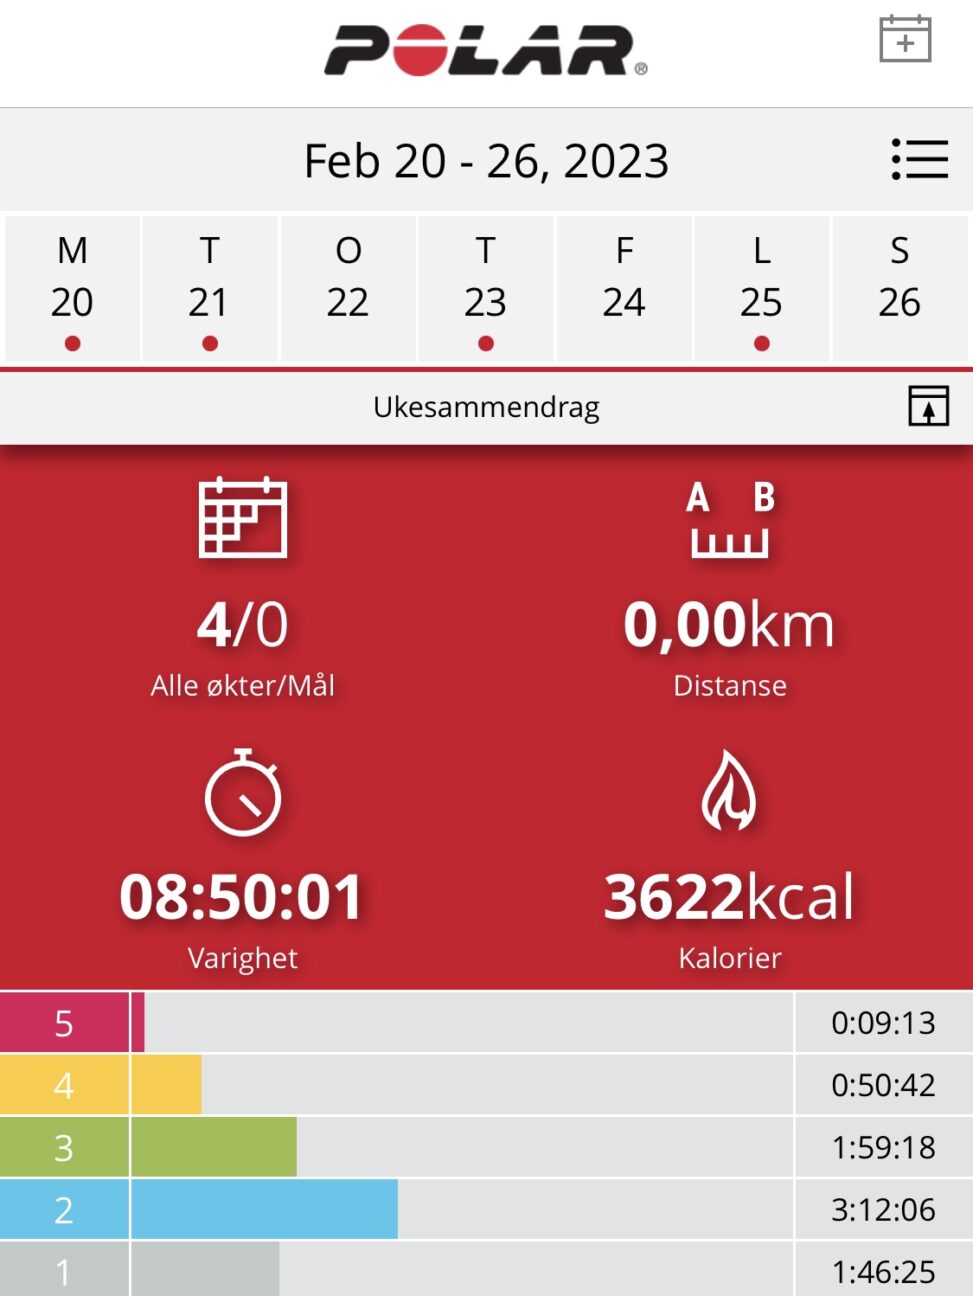
A typical week of my strength training sessions. The data is collected by using a watch, and then gathered in the Polar Flow app. The data shows the number of workouts, time used and calories burnt. It also shows the zones you are working in, based on heart rate, where 5 (pink) is the highest and 1 (grey) is the lowest.


