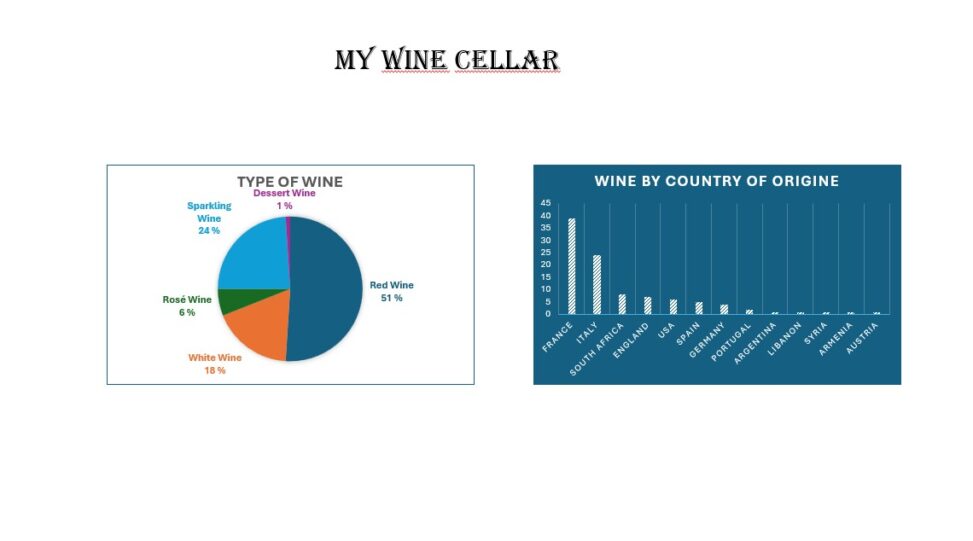
I am collecting wine, and the graphs show data from my cellar. First, it shows the % of different types of wine (red, white, rosé, sparkling, and dessert wine) and how many bottles I have from each country of origin

A SPLOT on the Web: DALI worlds.
Blame @cogdog for the TRU Collector Theme, based on Fukasawa by Anders Norén.
I am collecting wine, and the graphs show data from my cellar. First, it shows the % of different types of wine (red, white, rosé, sparkling, and dessert wine) and how many bottles I have from each country of origin