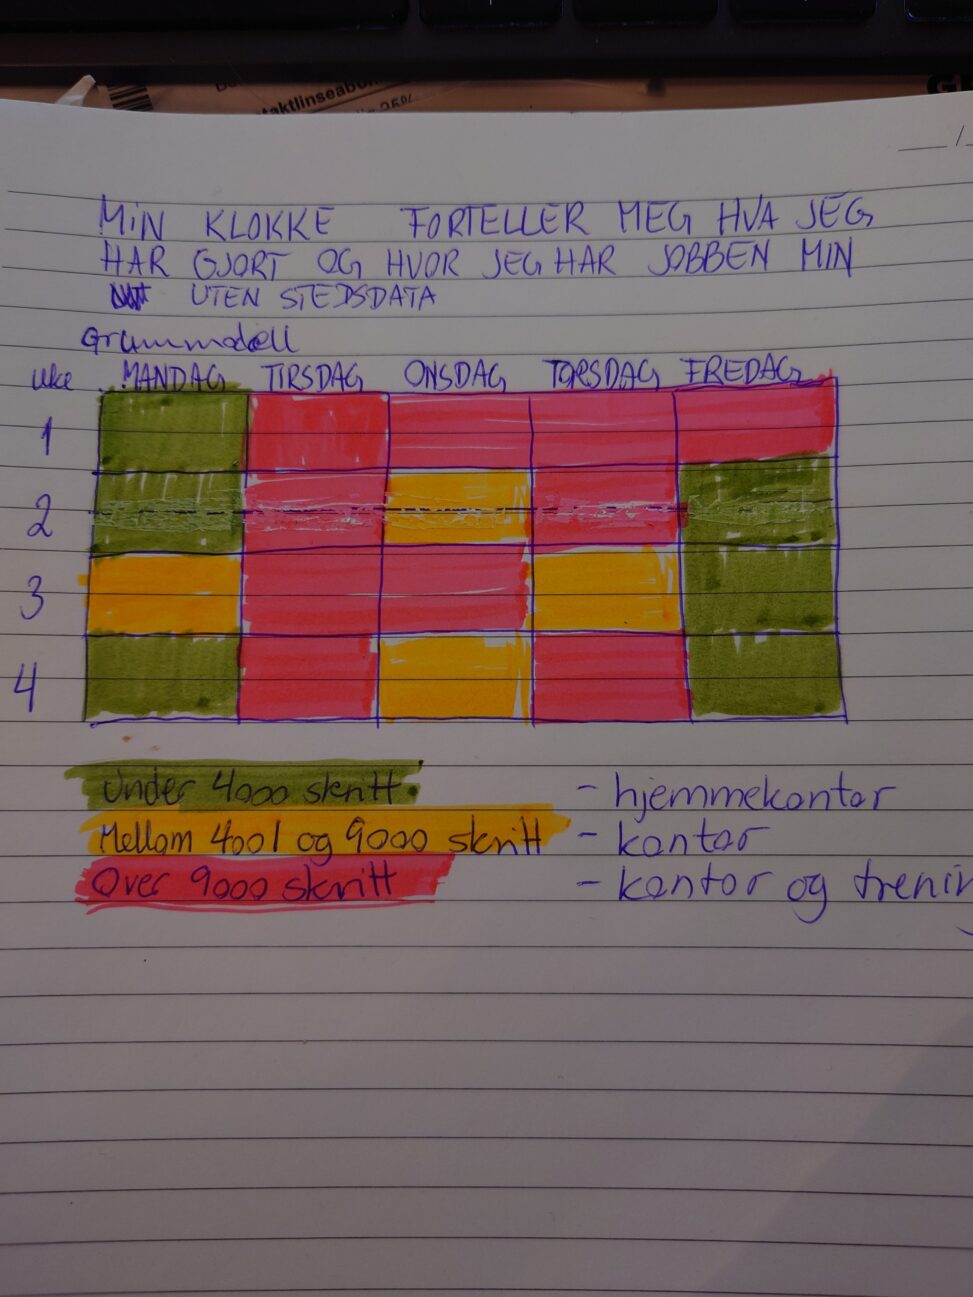
I have registered my number of steps each day. By working on the data for what day it was (monday – friday) and the number of steps I have every day for a month I managed to se the pattern for when i had my office at home (less than 4000 steps), when I had been in the office (4001-9000 steps) and when I had been in the office and done a training session at the gym (over 9000 steps). I do not need any location data.