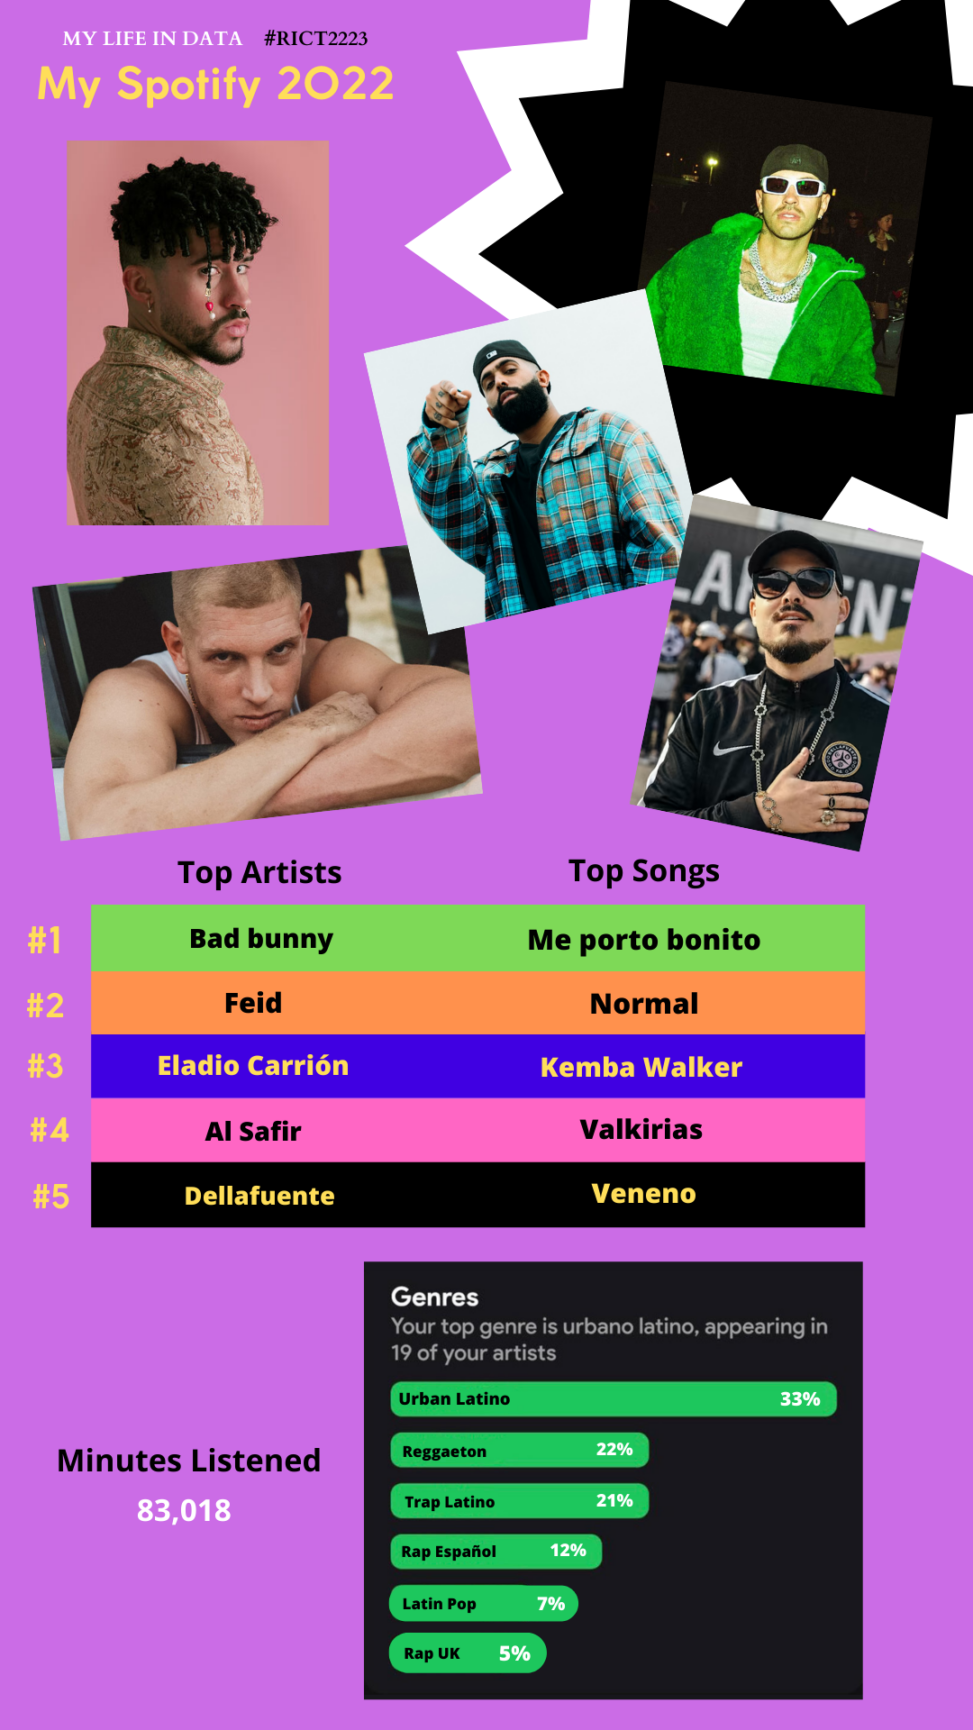
At the end of each year, the Spotify music application compiles, in a ranking, the list of your most listened to artists during that year. It also includes, respectively, the song you’ve heard the most times from each artist. In addition, it informs you of the minutes that you have spent listening to music in the application. I have also included a graph that shows, through percentages, the time that I have spent, within the application, listening to each of my favorite musical genres. Using the Canva application and based on the data collected by the application, I have created my own presentation summarizing my Spotify this 2022, reflecting, in a way, my musical tastes.


