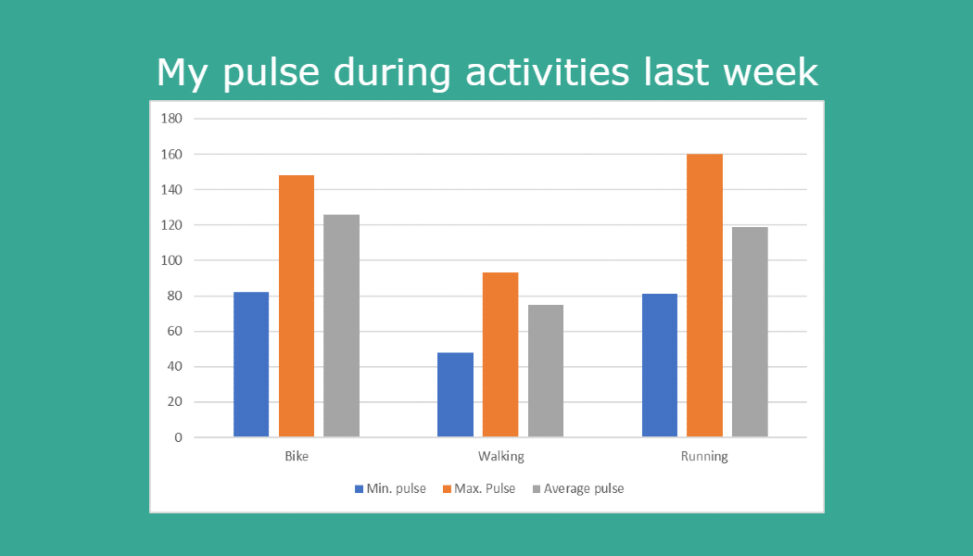
This picture shows my pulses average, min. and max. during different activities within a week. Data from my Garmin-watch, graph made by me in word and put in to a lovely background in the program www.pixlr.com
My own copyright.

A SPLOT on the Web: DALI worlds.
Blame @cogdog for the TRU Collector Theme, based on Fukasawa by Anders Norén.
This picture shows my pulses average, min. and max. during different activities within a week. Data from my Garmin-watch, graph made by me in word and put in to a lovely background in the program www.pixlr.com
My own copyright.