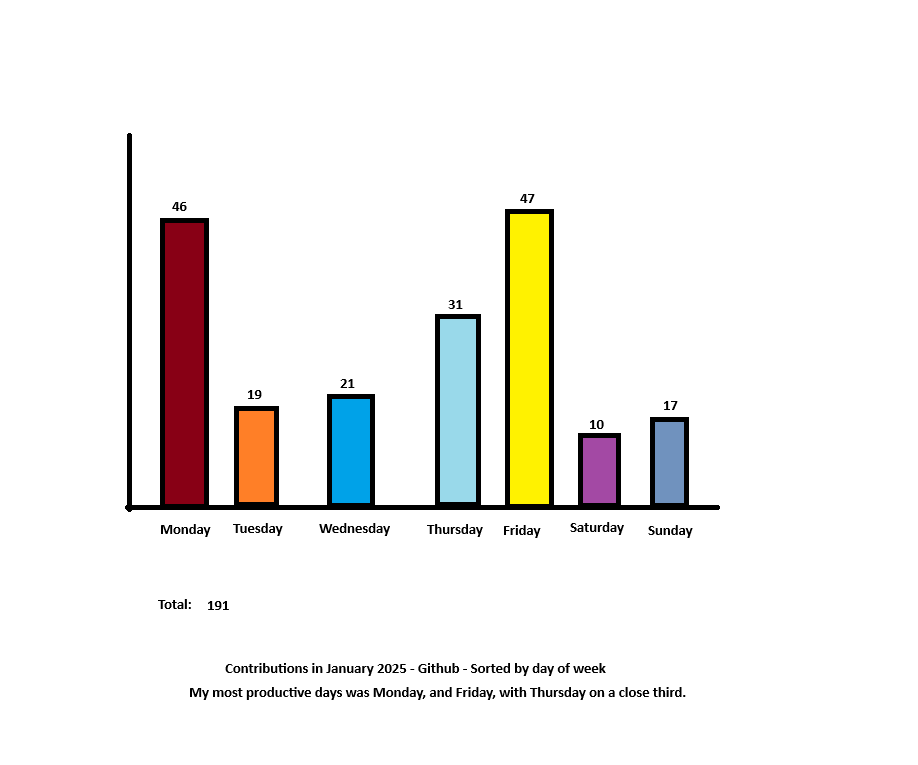
This is a bar chart visualisation of my Github contributions of January 2025, showing my contributions per day, and revealing my most productive days.

A SPLOT on the Web: DALI worlds.
Blame @cogdog for the TRU Collector Theme, based on Fukasawa by Anders Norén.
This is a bar chart visualisation of my Github contributions of January 2025, showing my contributions per day, and revealing my most productive days.