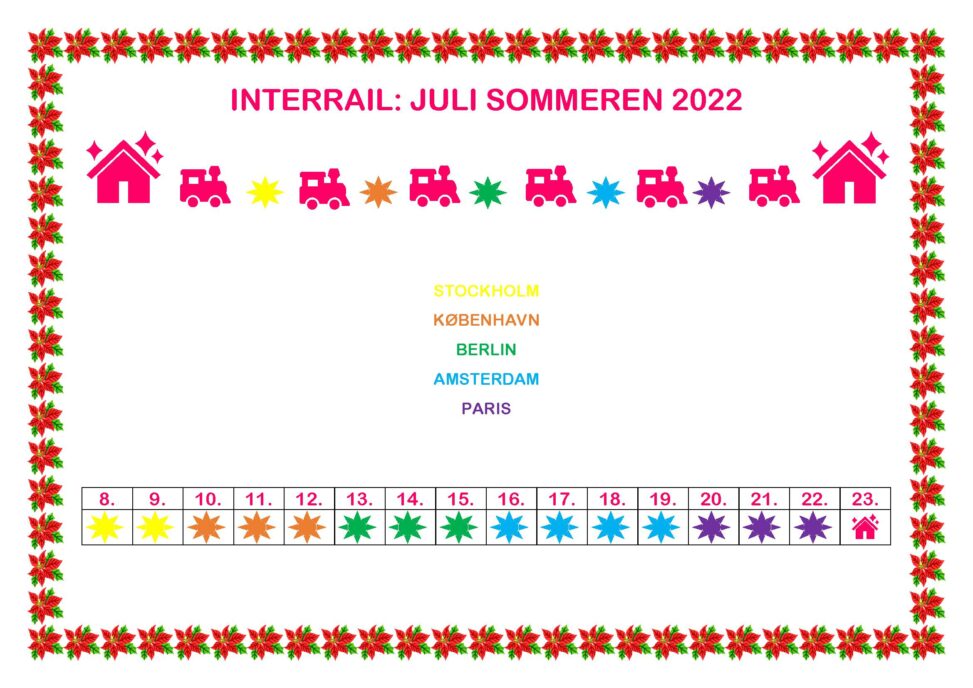
I made this image in a word-document. It shows how we divided our 2-ish weeks of travel days between 5 european cities, and the chart tells where we were when :-).

A SPLOT on the Web: DALI worlds.
Blame @cogdog for the TRU Collector Theme, based on Fukasawa by Anders Norén.
I made this image in a word-document. It shows how we divided our 2-ish weeks of travel days between 5 european cities, and the chart tells where we were when :-).