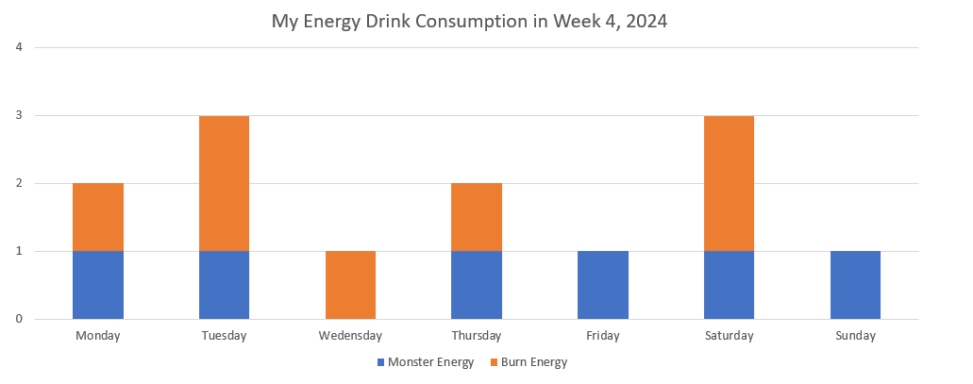
Graph represents amount of energy drinks consumed every day in week 4 of 2024.
X-axis shows day of the week.
Y-axis shows amount of energy drinks consumed.
All information collected from me in week 4 (22.01-28.01) in 2024.

A SPLOT on the Web: DALI worlds.
Blame @cogdog for the TRU Collector Theme, based on Fukasawa by Anders Norén.
Graph represents amount of energy drinks consumed every day in week 4 of 2024.
X-axis shows day of the week.
Y-axis shows amount of energy drinks consumed.
All information collected from me in week 4 (22.01-28.01) in 2024.