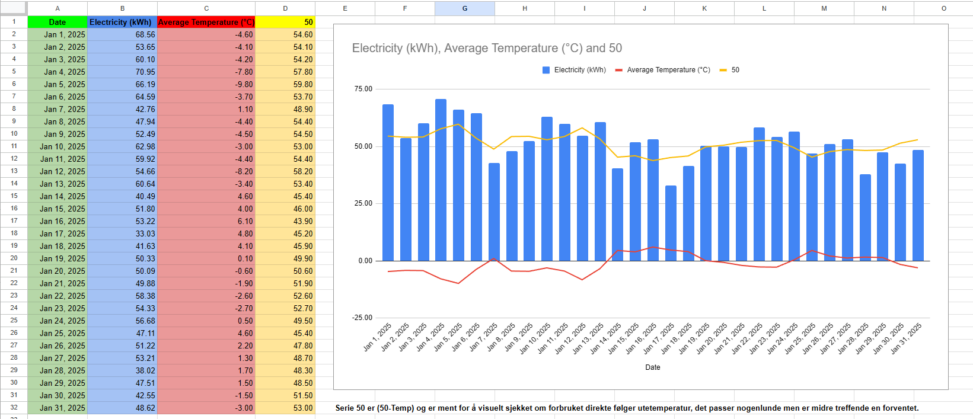
My Electricity usage vs the outside temperature for January 2025
It is a test to see how my electricity usage follows the outside temperature.
The yellow line (50) is a function (50-Temp) to visualize better against the electricity graph.
The result was not as expected as the relation was not as direct as envisioned.