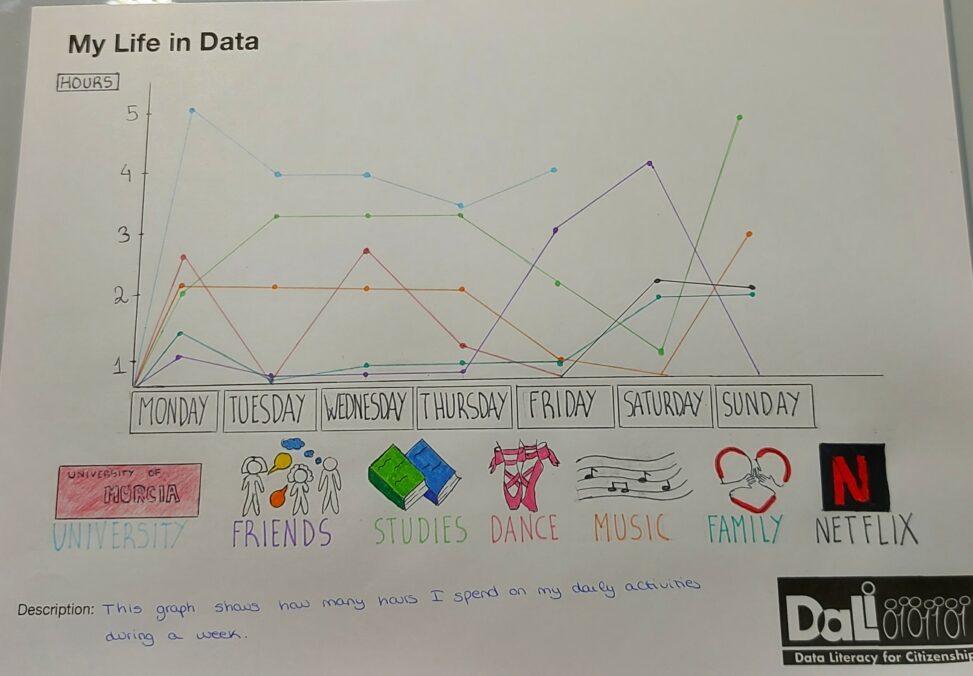
This is a graph representing the daily hours I spend on my daily activities over the course of a week, such as time spent studying or listening to music. Each activity is represented by a colour, which in the graph represents the number of hours I spend.