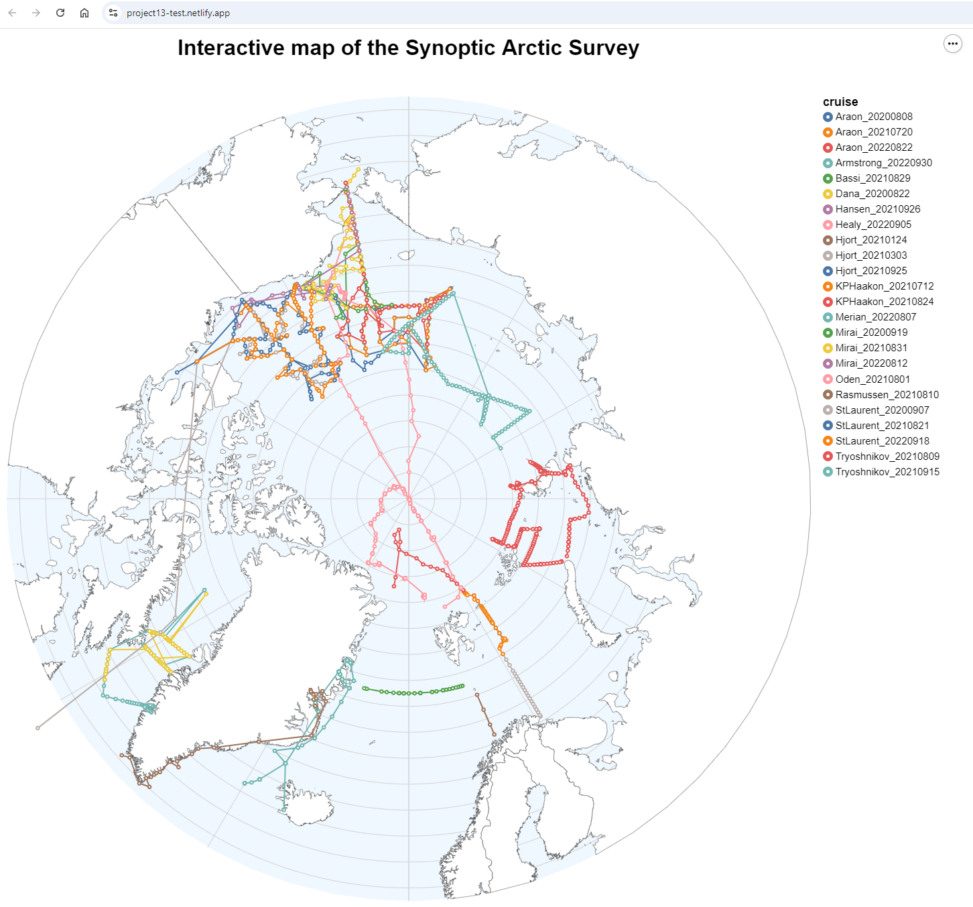
The development of an interactive map is part of my work as a project coordinator for the Synoptic Arctic Survey (SAS). Here is a snapshot of the current prototype. SAS coordinated scientific cruises that collected measurements in the Arctic Ocean to map climate change. This data visualization shows the tracks of all the cruises conducted in 2020-2022. The owners of the raw data are the research institutions that conducted the cruises and the measurements. The map is owned by the Synoptic Arctic Survey program. Copyright is to be determined when the map is further developed.


