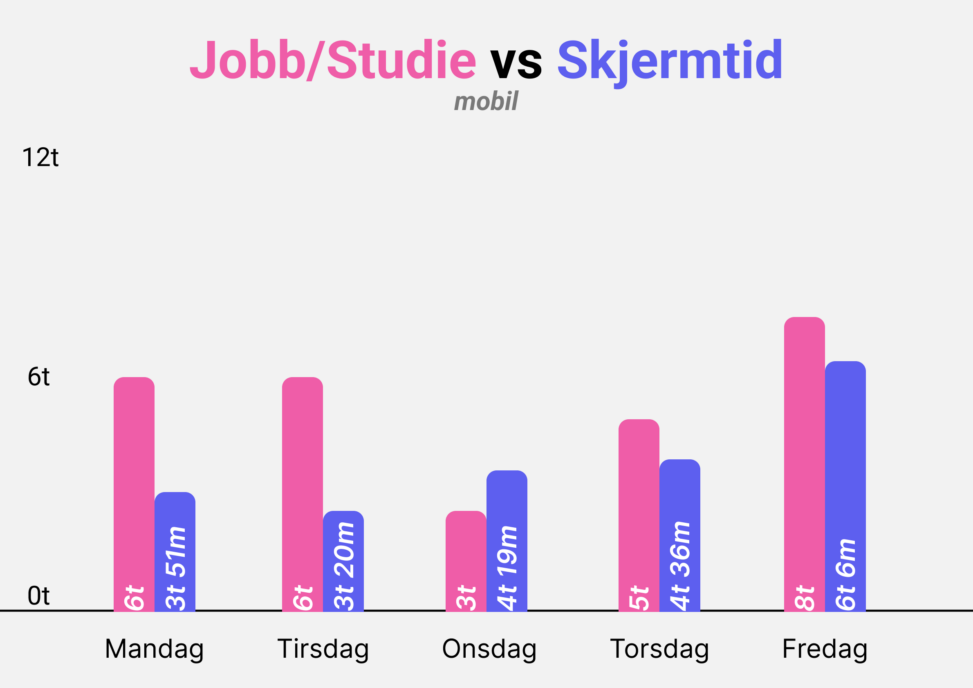
This is the relationship between my screen time for mobile and my job/study time week 33.
On the x axis are the days, while on the y axis are the number of hours. Each graph shows the number of hours for each graph.

This is the relationship between my screen time for mobile and my job/study time week 33.
On the x axis are the days, while on the y axis are the number of hours. Each graph shows the number of hours for each graph.