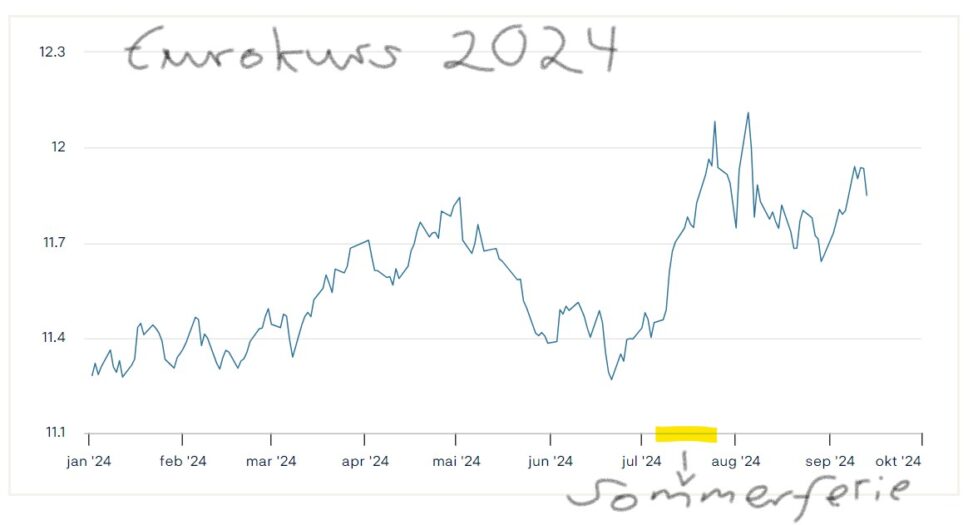
Copy of diagram from the Norwegian Bank visualizing the EURO currency rates per day in 2024, with the currency rate from 11.1. to 12.3 listed on the Y graph and the months from January to October on the X graph. Comment and marking for the period of July, as the currency rate affected our summer Holliday.