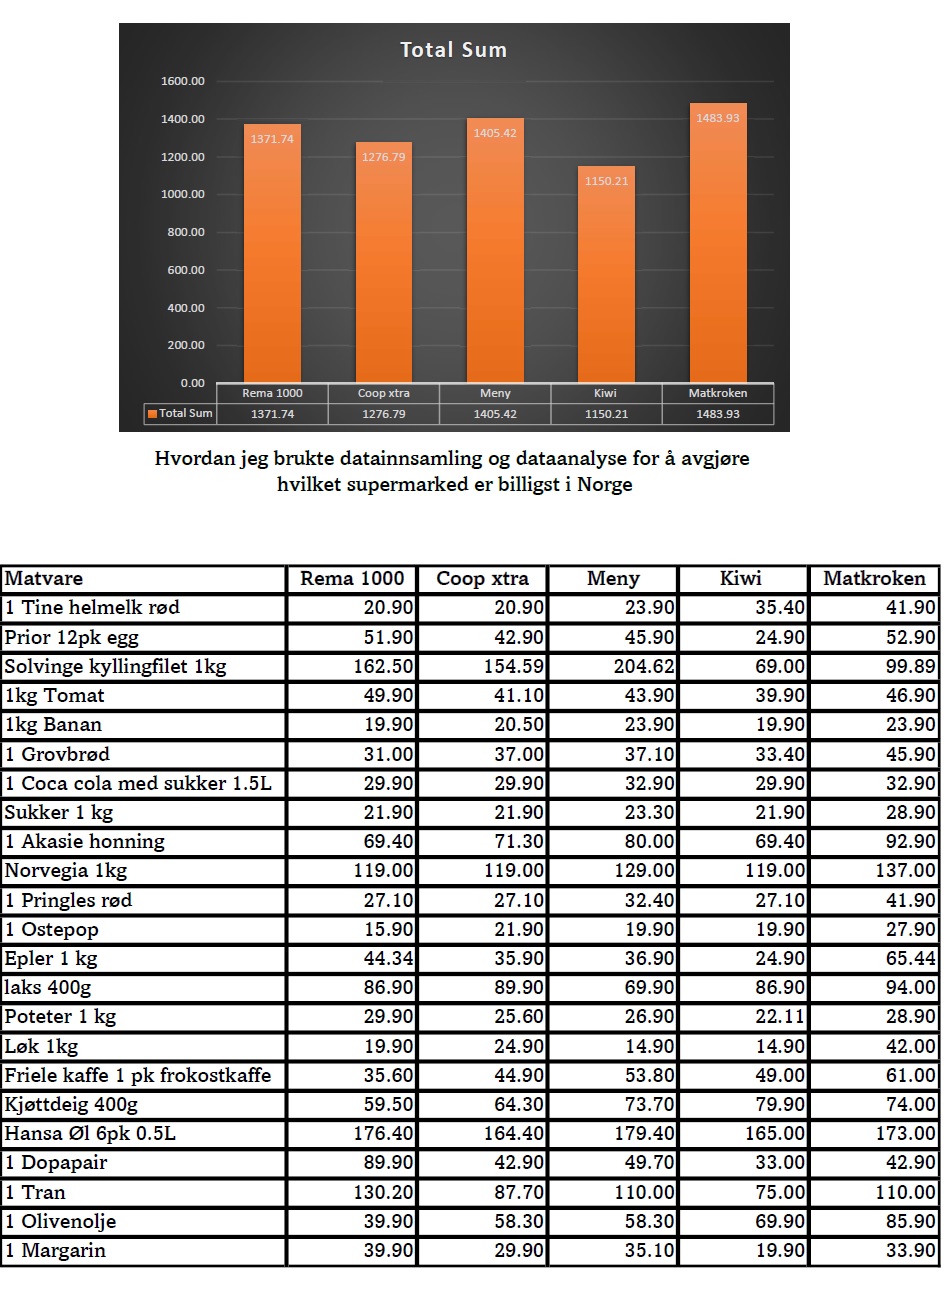
First, I made a list of a possible weekly shopping list. Then I went to different supermarkets and wrote down the prices of items on an Excel sheet (Data Collection). Then I used Excel to decide the sum of each store alone. Finally, I created a bar graph comparing the prices (Data Analysis)


