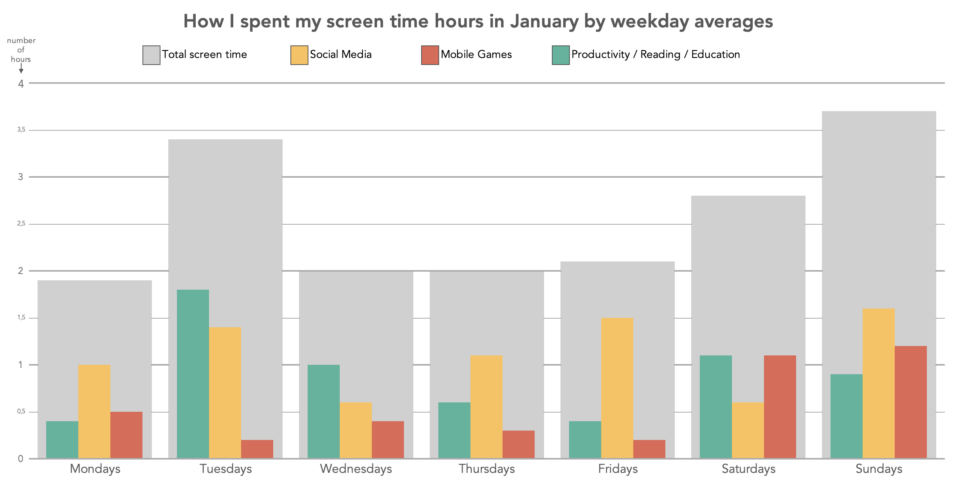
Chart showing how many hours of my screen time I spend doing different kinds of activities on my phone. The screen time activities are divided into (1) Productivity / Reading / Education (email, reading articles, google docs etg.), (2) Social Media (Facebook, Snapchat, Whatsapp, Messages), and (3) Mobile Games (mostly solitare).
The screen time is divided into an average for each of the weekdays. This means that “Monday” shows the average time I spent, in total and in each of the categories, over all the Mondays in January until today.
I am the owner of my data, as it is from my own screen time reports.


