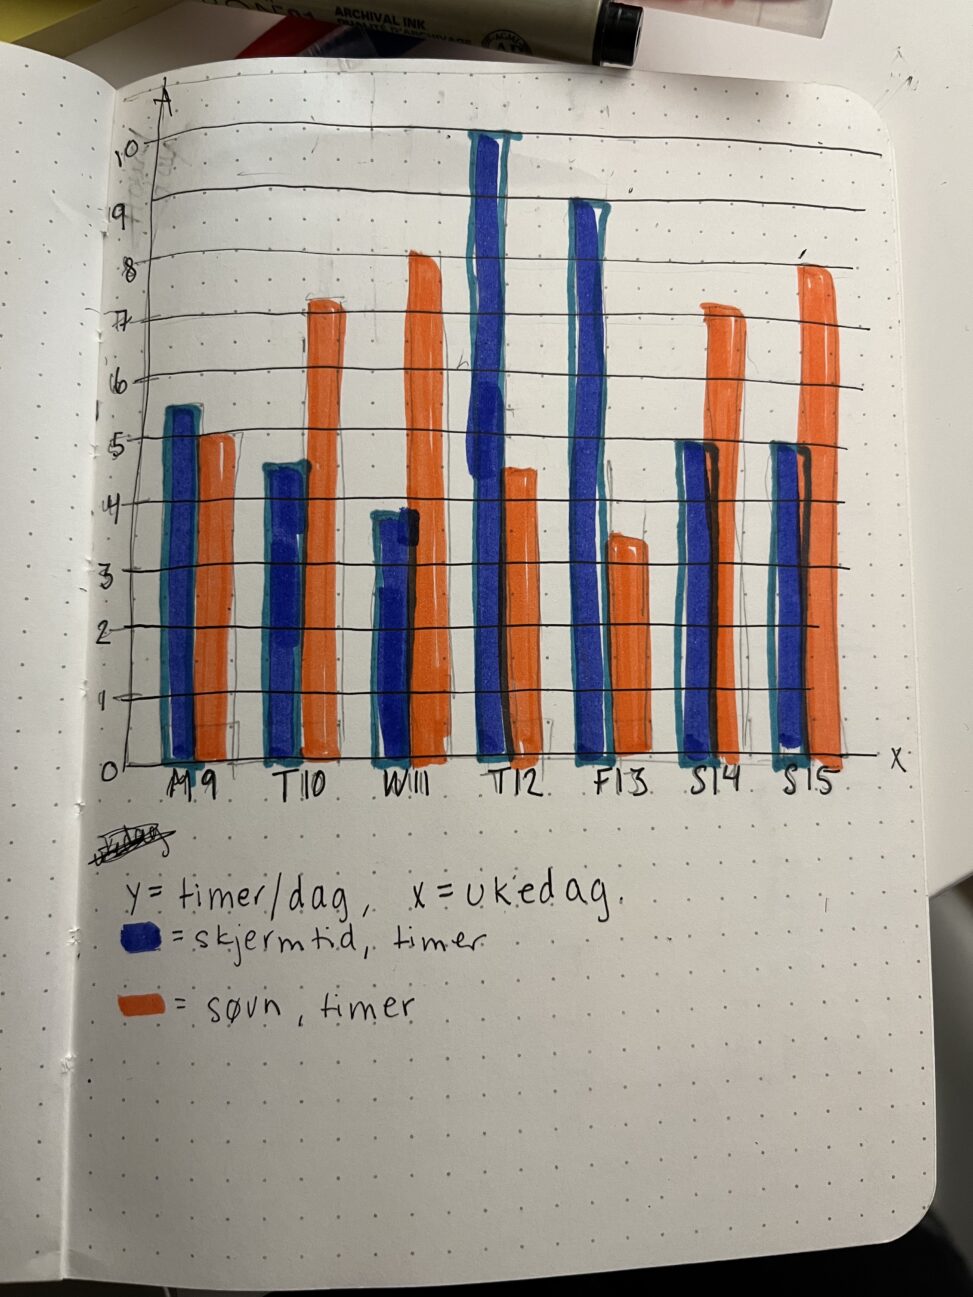
Amount of hours of sleep per day and hours of screen time per day are represented in a bar diagram. The blue bars represent hours of screen time, the orange bars represent hours of sleep. The x-axis is the day of the week (labelled initial “m” for monday, and the date “9” for 9th september for example) and the Y axis is hours per day. The data was collected from my iphone screen time monitor and health-app sleep tracker, and additionally from a manual sleep log I keep.