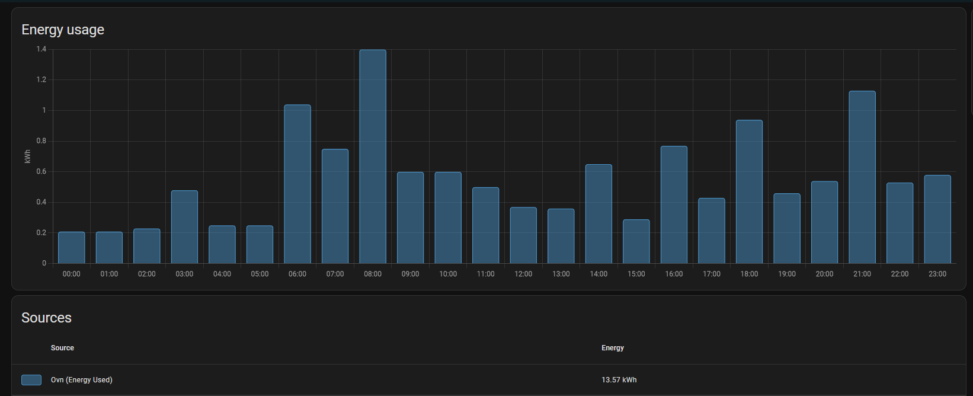
This image shows a bar graph where each bar represents 1 hour of time, and the value that the graph is showing is how much kWh my oven used each hour yesterday. Below the graph, you can see the total amount of kWh that the oven used for the entire day.


