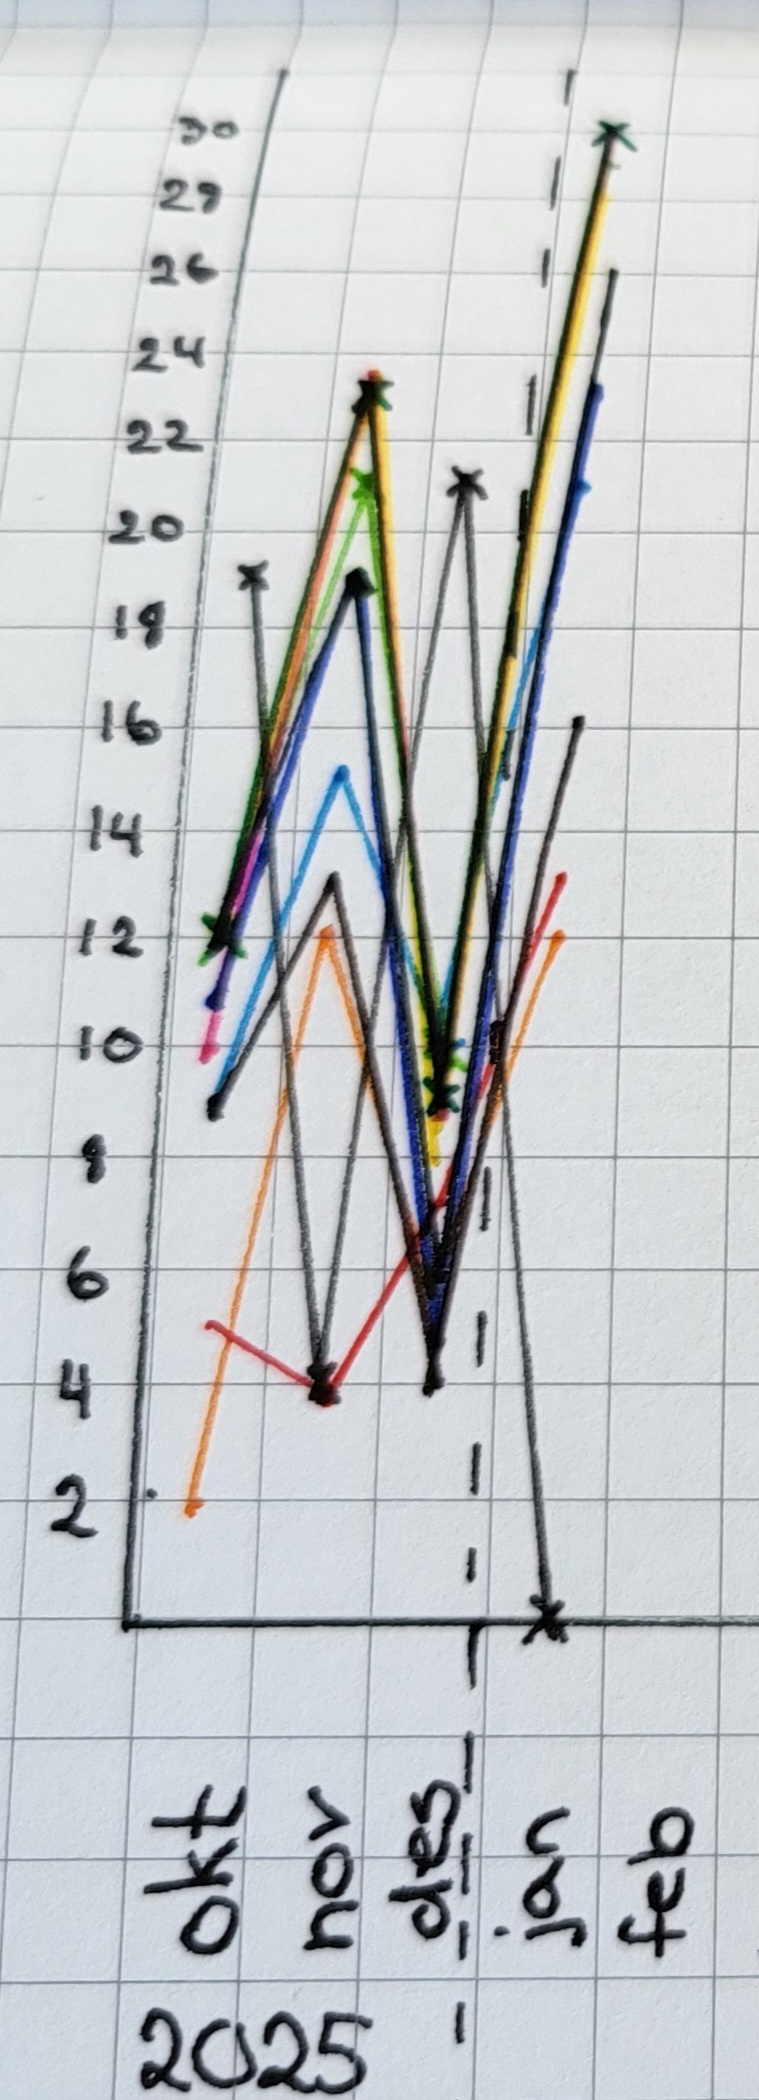
Each color represents one good intention. The graphs visualizes how many days per month I have been successful in completing the different intentions.
This data is Public Domain.
No one is owner of the data.

A SPLOT on the Web: DALI worlds.
Blame @cogdog for the TRU Collector Theme, based on Fukasawa by Anders Norén.
Each color represents one good intention. The graphs visualizes how many days per month I have been successful in completing the different intentions.
This data is Public Domain.
No one is owner of the data.