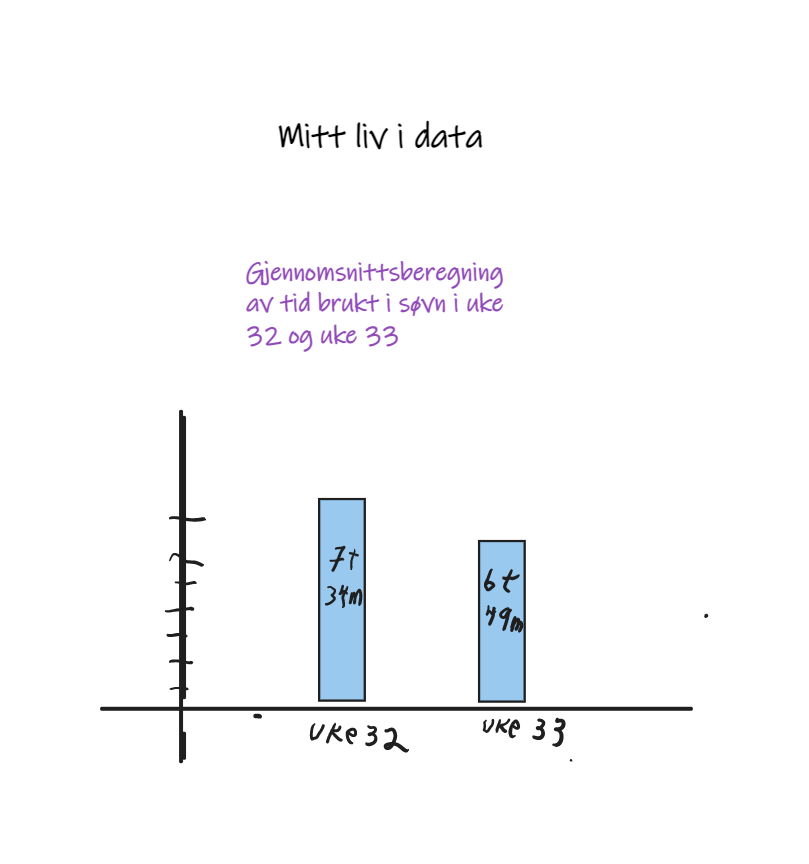
This is a representation of time spent sleeping in two weeks, mean of one week is represented as one column in the graph. Data is my own.

A SPLOT on the Web: DALI worlds.
Blame @cogdog for the TRU Collector Theme, based on Fukasawa by Anders Norén.
This is a representation of time spent sleeping in two weeks, mean of one week is represented as one column in the graph. Data is my own.