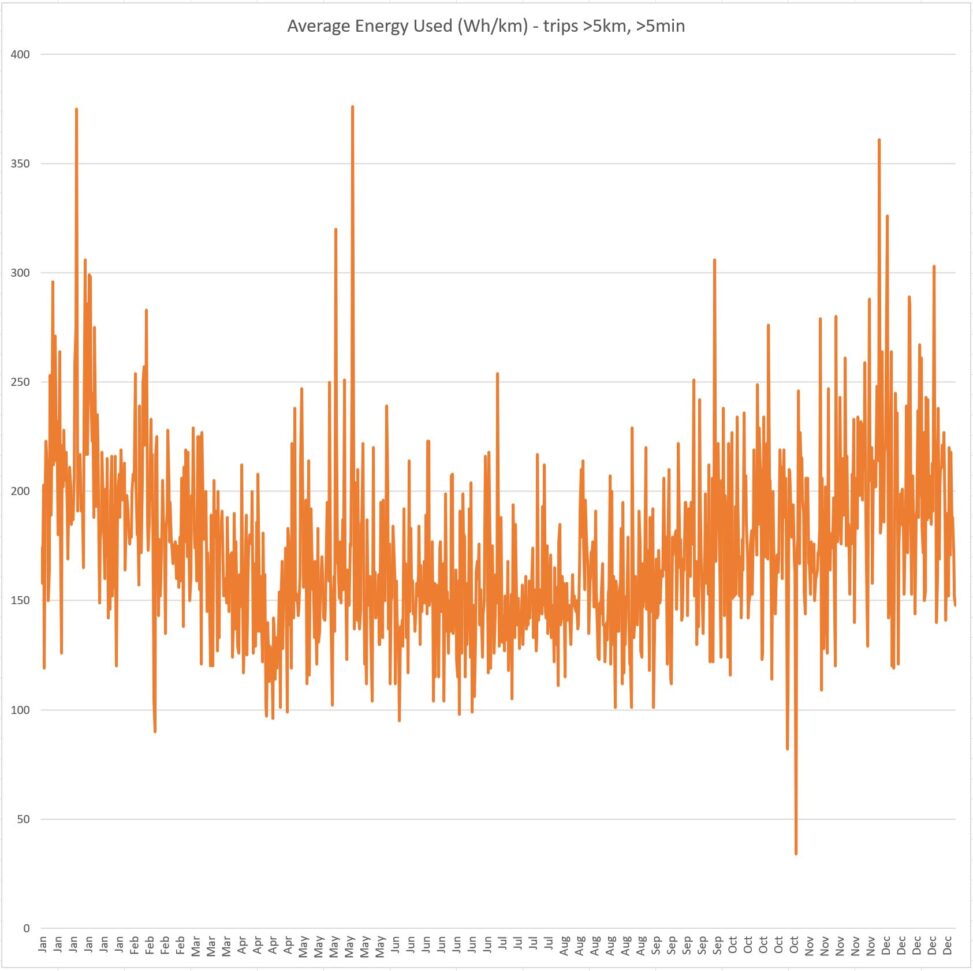
Trip data for my car was collected from app API and imported to Excel. Trips shorter than 5 minutes and/or 5 kilometers were removed. “Average energy used” [wh/km] and “Month” were presented in a line diagram to see if there is a visual correlasion between energy consumption and time of the year (winter/summer).


